Note
Go to the end to download the full example code.
Timestamp
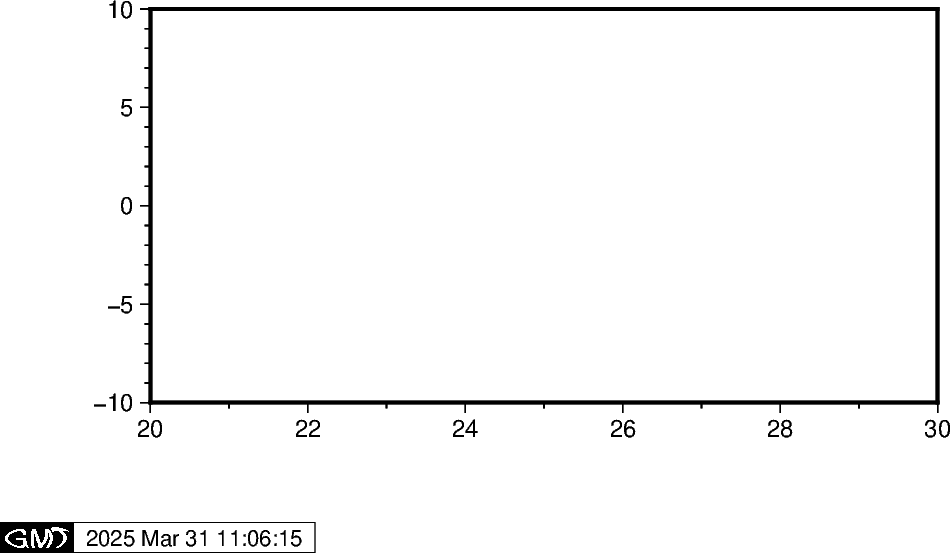
The pygmt.Figure.timestamp method can draw the GMT timestamp logo on the plot.
The timestamp will always be shown relative to the Bottom Left (BL) corner of the plot.
By default, the offset and justify parameters are set to ("-54p", "-54p")
(x-, y-directions) and "BL" (Bottom Left), respectively.
import os

import pygmt
from pygmt.params import Axis

fig = pygmt.Figure()
fig.basemap(region=[20, 30, -10, 10], projection="X10c/5c", frame=True)
fig.timestamp()
fig.show()
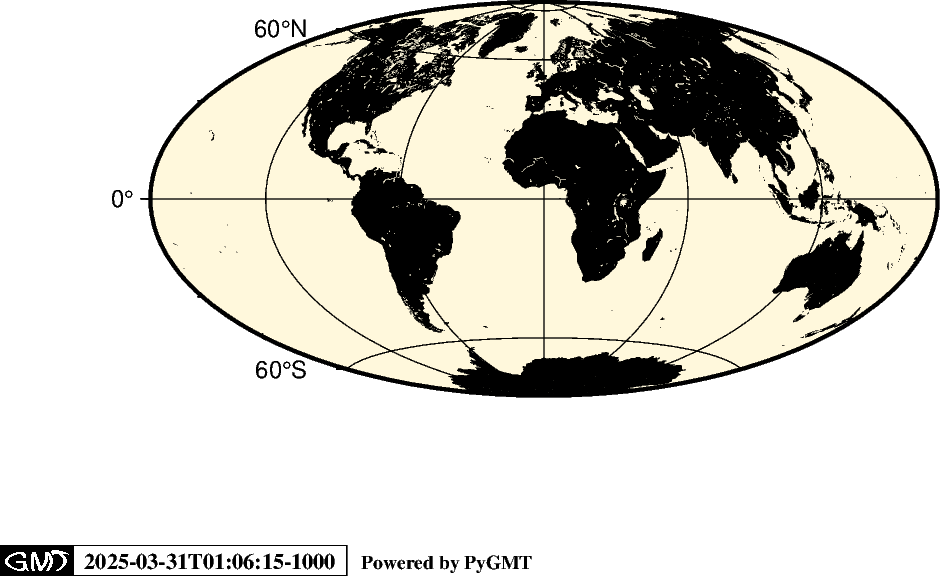
Additionally, a custom label can be added via the label parameter. The font can be
defined via the font parameter and the timestamp string format via timefmt.
os.environ["TZ"] = "Pacific/Honolulu"  # optionally set the time zone

fig = pygmt.Figure()
fig.coast(
    region="d",
    projection="H10c",
    land="black",
    water="cornsilk",
    frame=Axis(annot=True, tick=True, grid=True),
)
fig.timestamp(
    label="Powered by PyGMT",
    justify="TL",
    font="Times-Bold",
    timefmt="%Y-%m-%dT%H:%M:%S%z",
)
fig.show()
Total running time of the script: (0 minutes 0.326 seconds)