Note
Go to the end to download the full example code.
Frames, ticks, titles, and labels
Setting frame, ticks, titles, and labels is handled by the frame parameter that
many plotting methods of the pygmt.Figure class accept. This tutorial focuses
on setting the frame parameter using the pygmt.params.Axis and
pygmt.params.Frame classes.
Plot frame
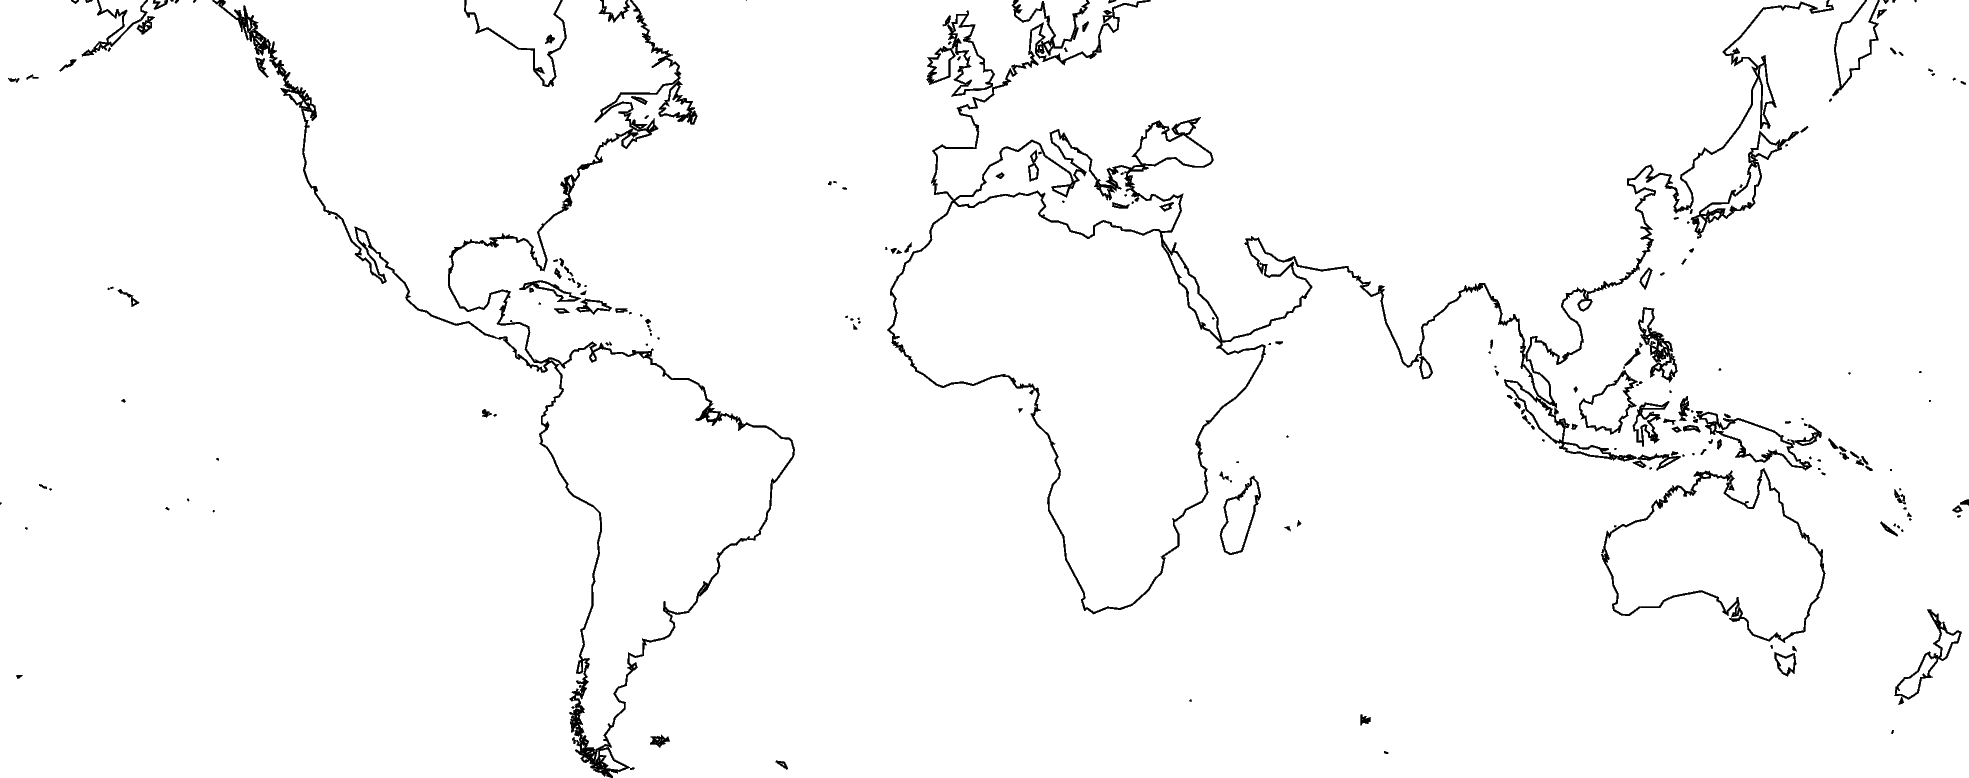
By default, PyGMT does not add a frame to your plot. For example, we can plot the coastlines of the world with a Mercator projection:
fig = pygmt.Figure()
fig.coast(shorelines="1/0.5p", region=[-180, 180, -60, 60], projection="M15c")
fig.show()
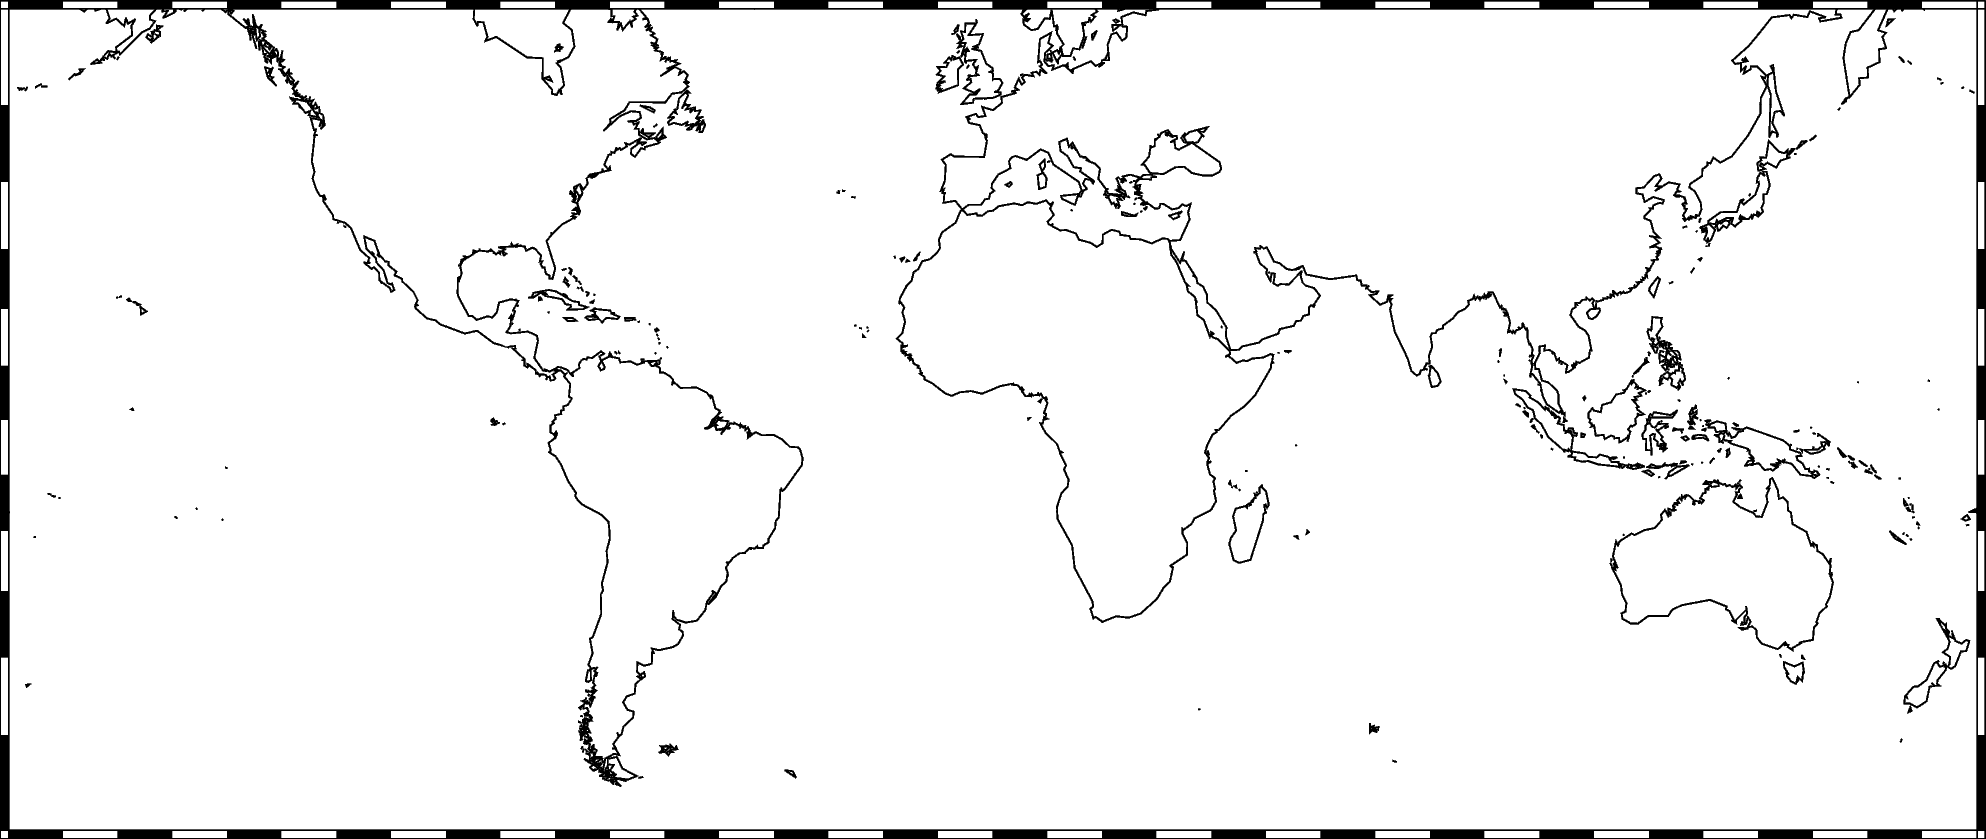
To add the default GMT frame style to the plot, use frame=True in
pygmt.Figure.basemap or another plotting method that accepts a frame
parameter:
fig = pygmt.Figure()
fig.coast(shorelines="1/0.5p", region=[-180, 180, -60, 60], projection="M15c")
fig.basemap(frame=True)
fig.show()
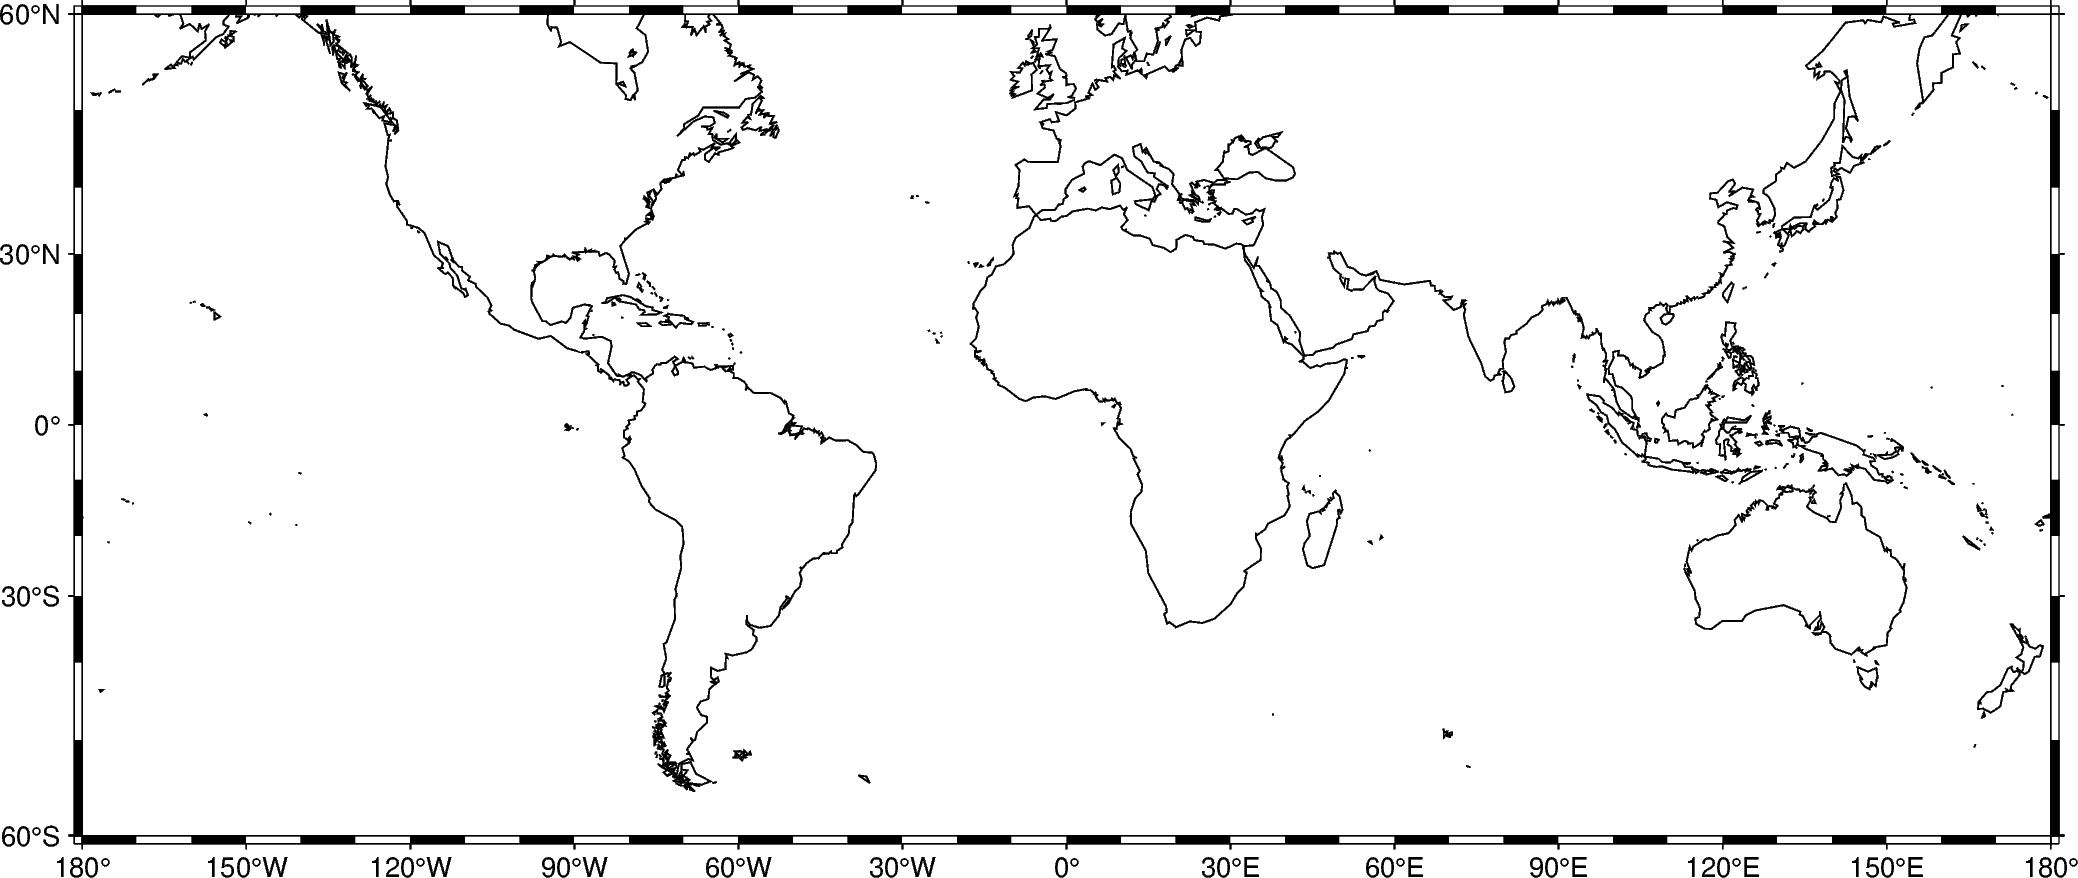
Annotations, tick marks and grid lines
The default frame style includes tick labels (called annotations in GMT) and tick
marks at intervals determined by GMT, but doesn’t include grid lines. To control
the presence and intervals of annotations, tick marks, and grid lines, you can use the
pygmt.params.Axis class. The annot, tick, and grid attributes of
pygmt.params.Axis control the presence and intervals of annotations, tick
marks, and grid lines, respectively. Setting them to True adds them at intervals
determined by GMT:
fig = pygmt.Figure()
fig.coast(shorelines="1/0.5p", region=[-180, 180, -60, 60], projection="M15c")
fig.basemap(frame=Axis(annot=True, tick=True, grid=True))
fig.show()
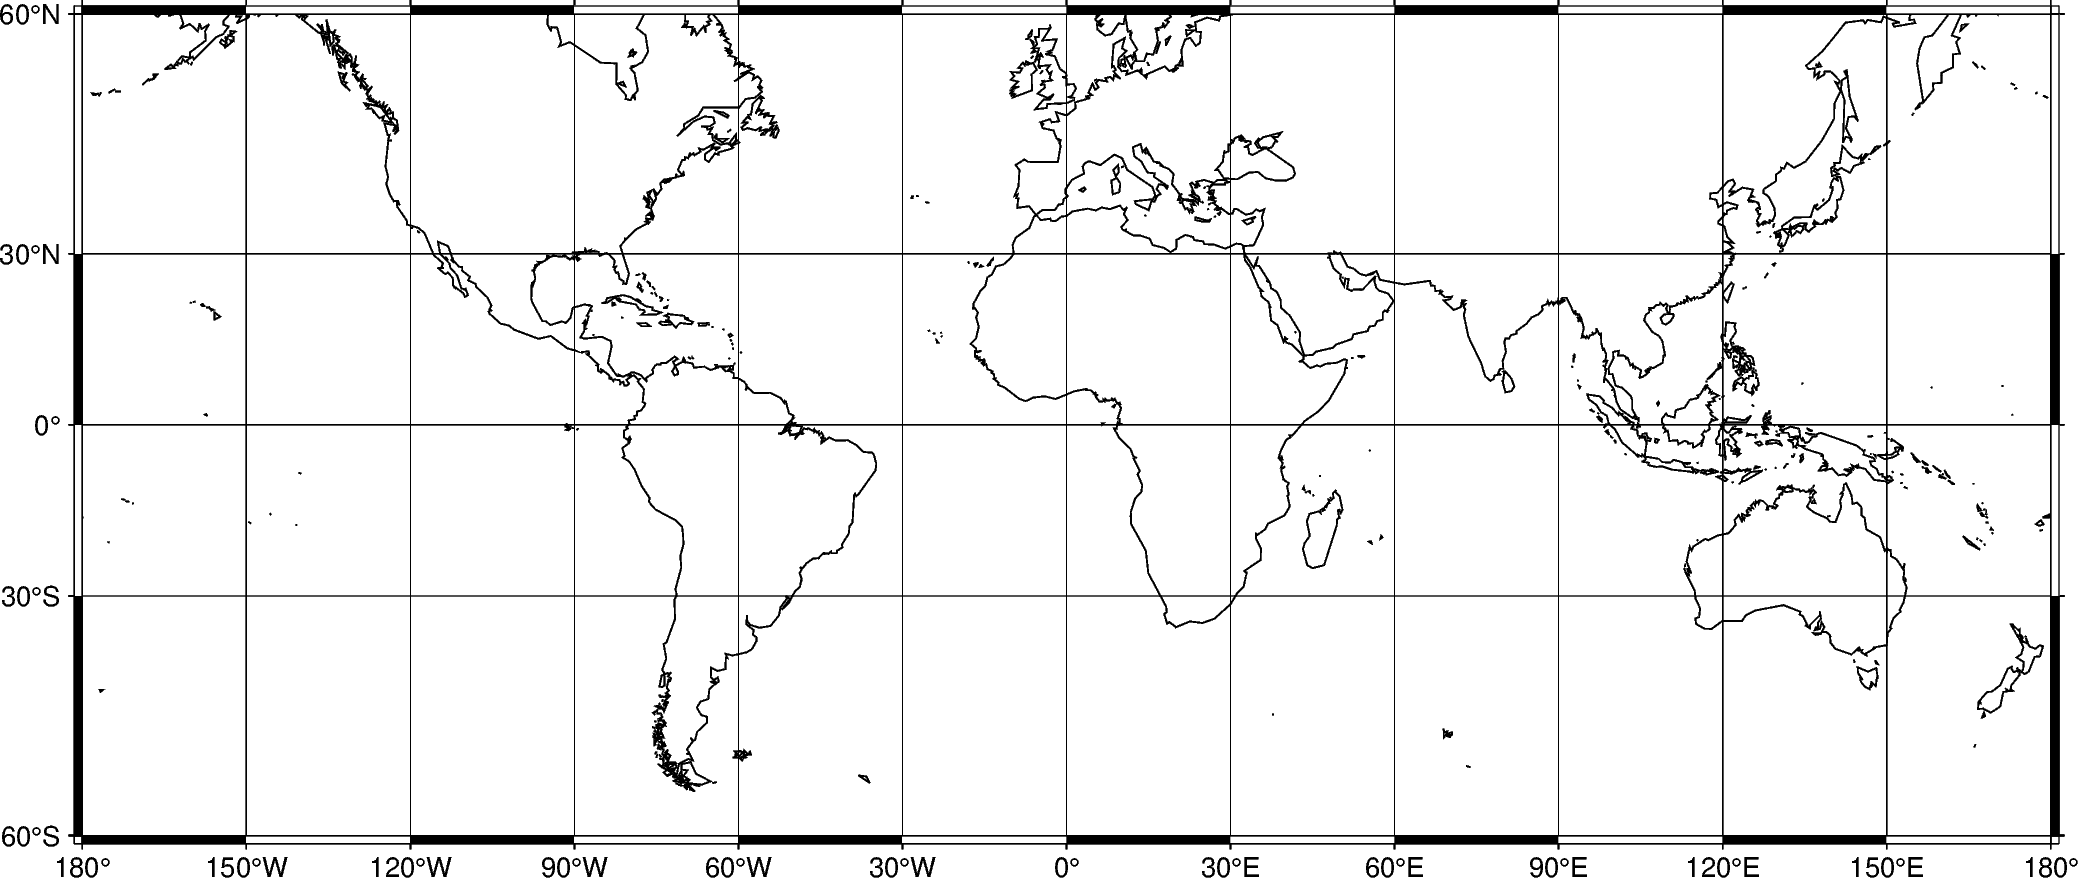
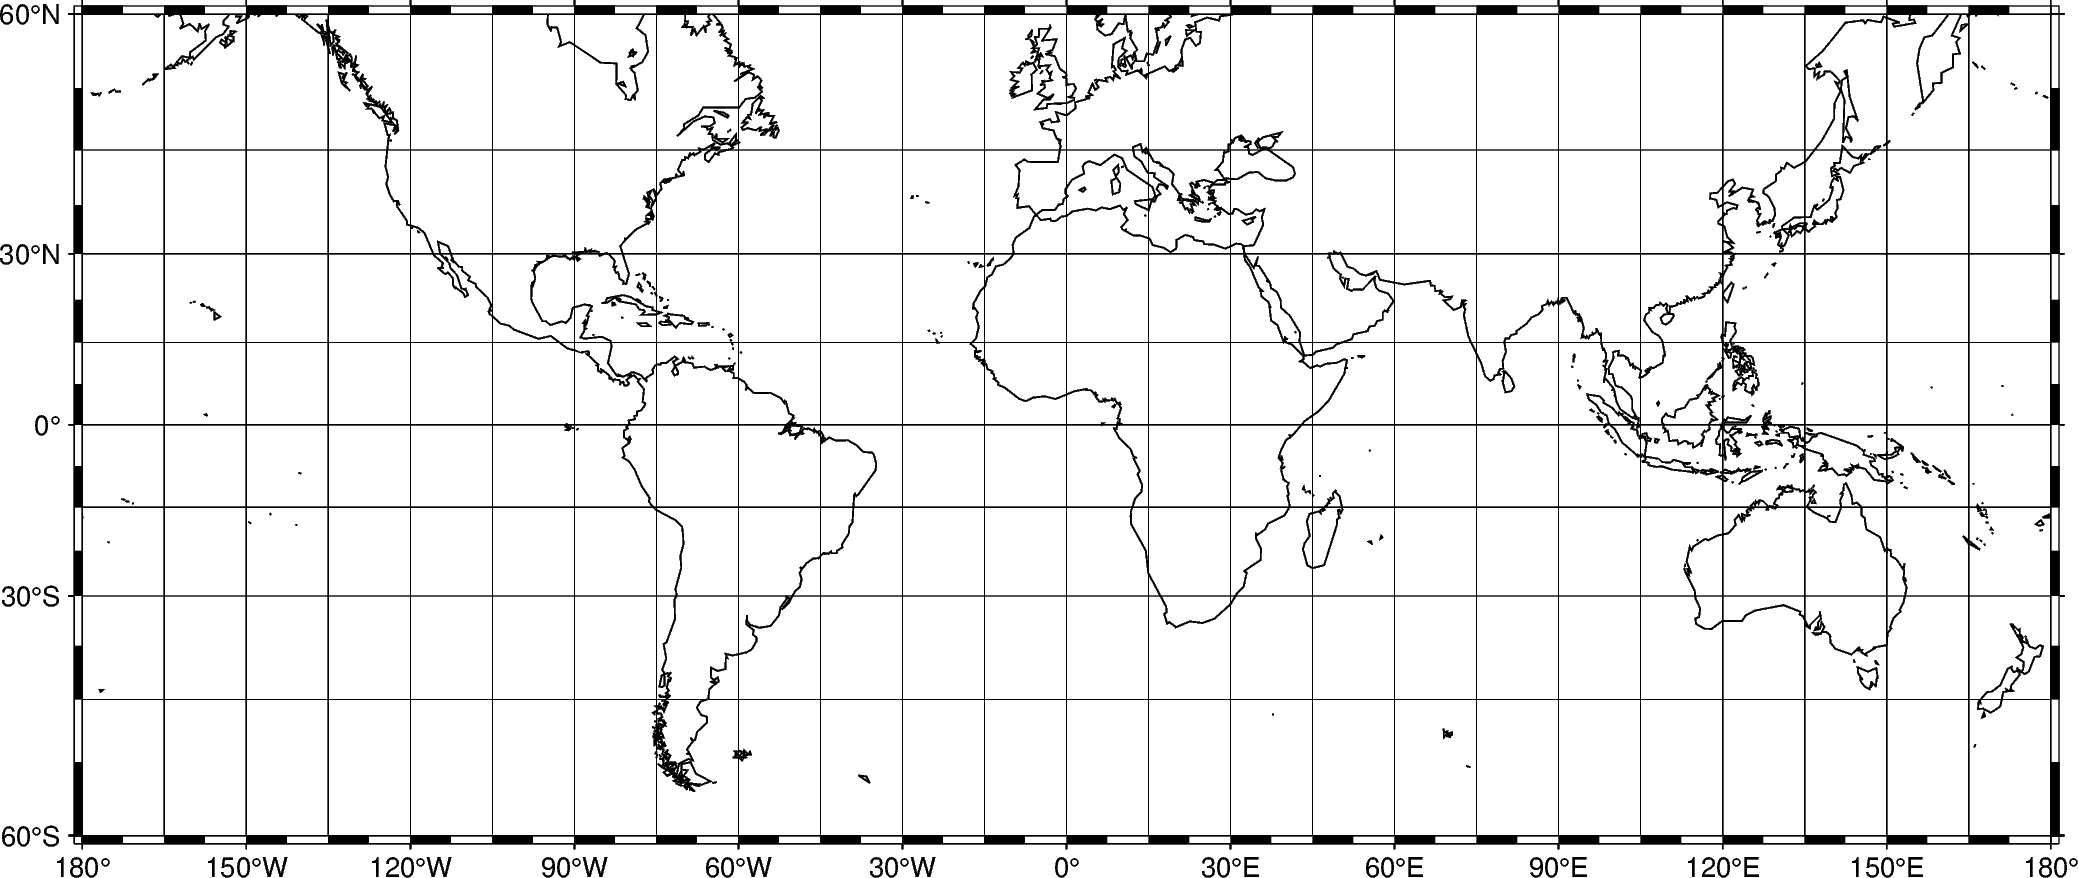
To set specific intervals, pass values to annot, tick, and grid. In the
example below, the annotation, tick, and gridline intervals are set to 30, 7.5, and
15 degrees, respectively.
fig = pygmt.Figure()
fig.coast(shorelines="1/0.5p", region=[-180, 180, -60, 60], projection="M15c")
fig.basemap(frame=Axis(annot=30, tick=7.5, grid=15))
fig.show()
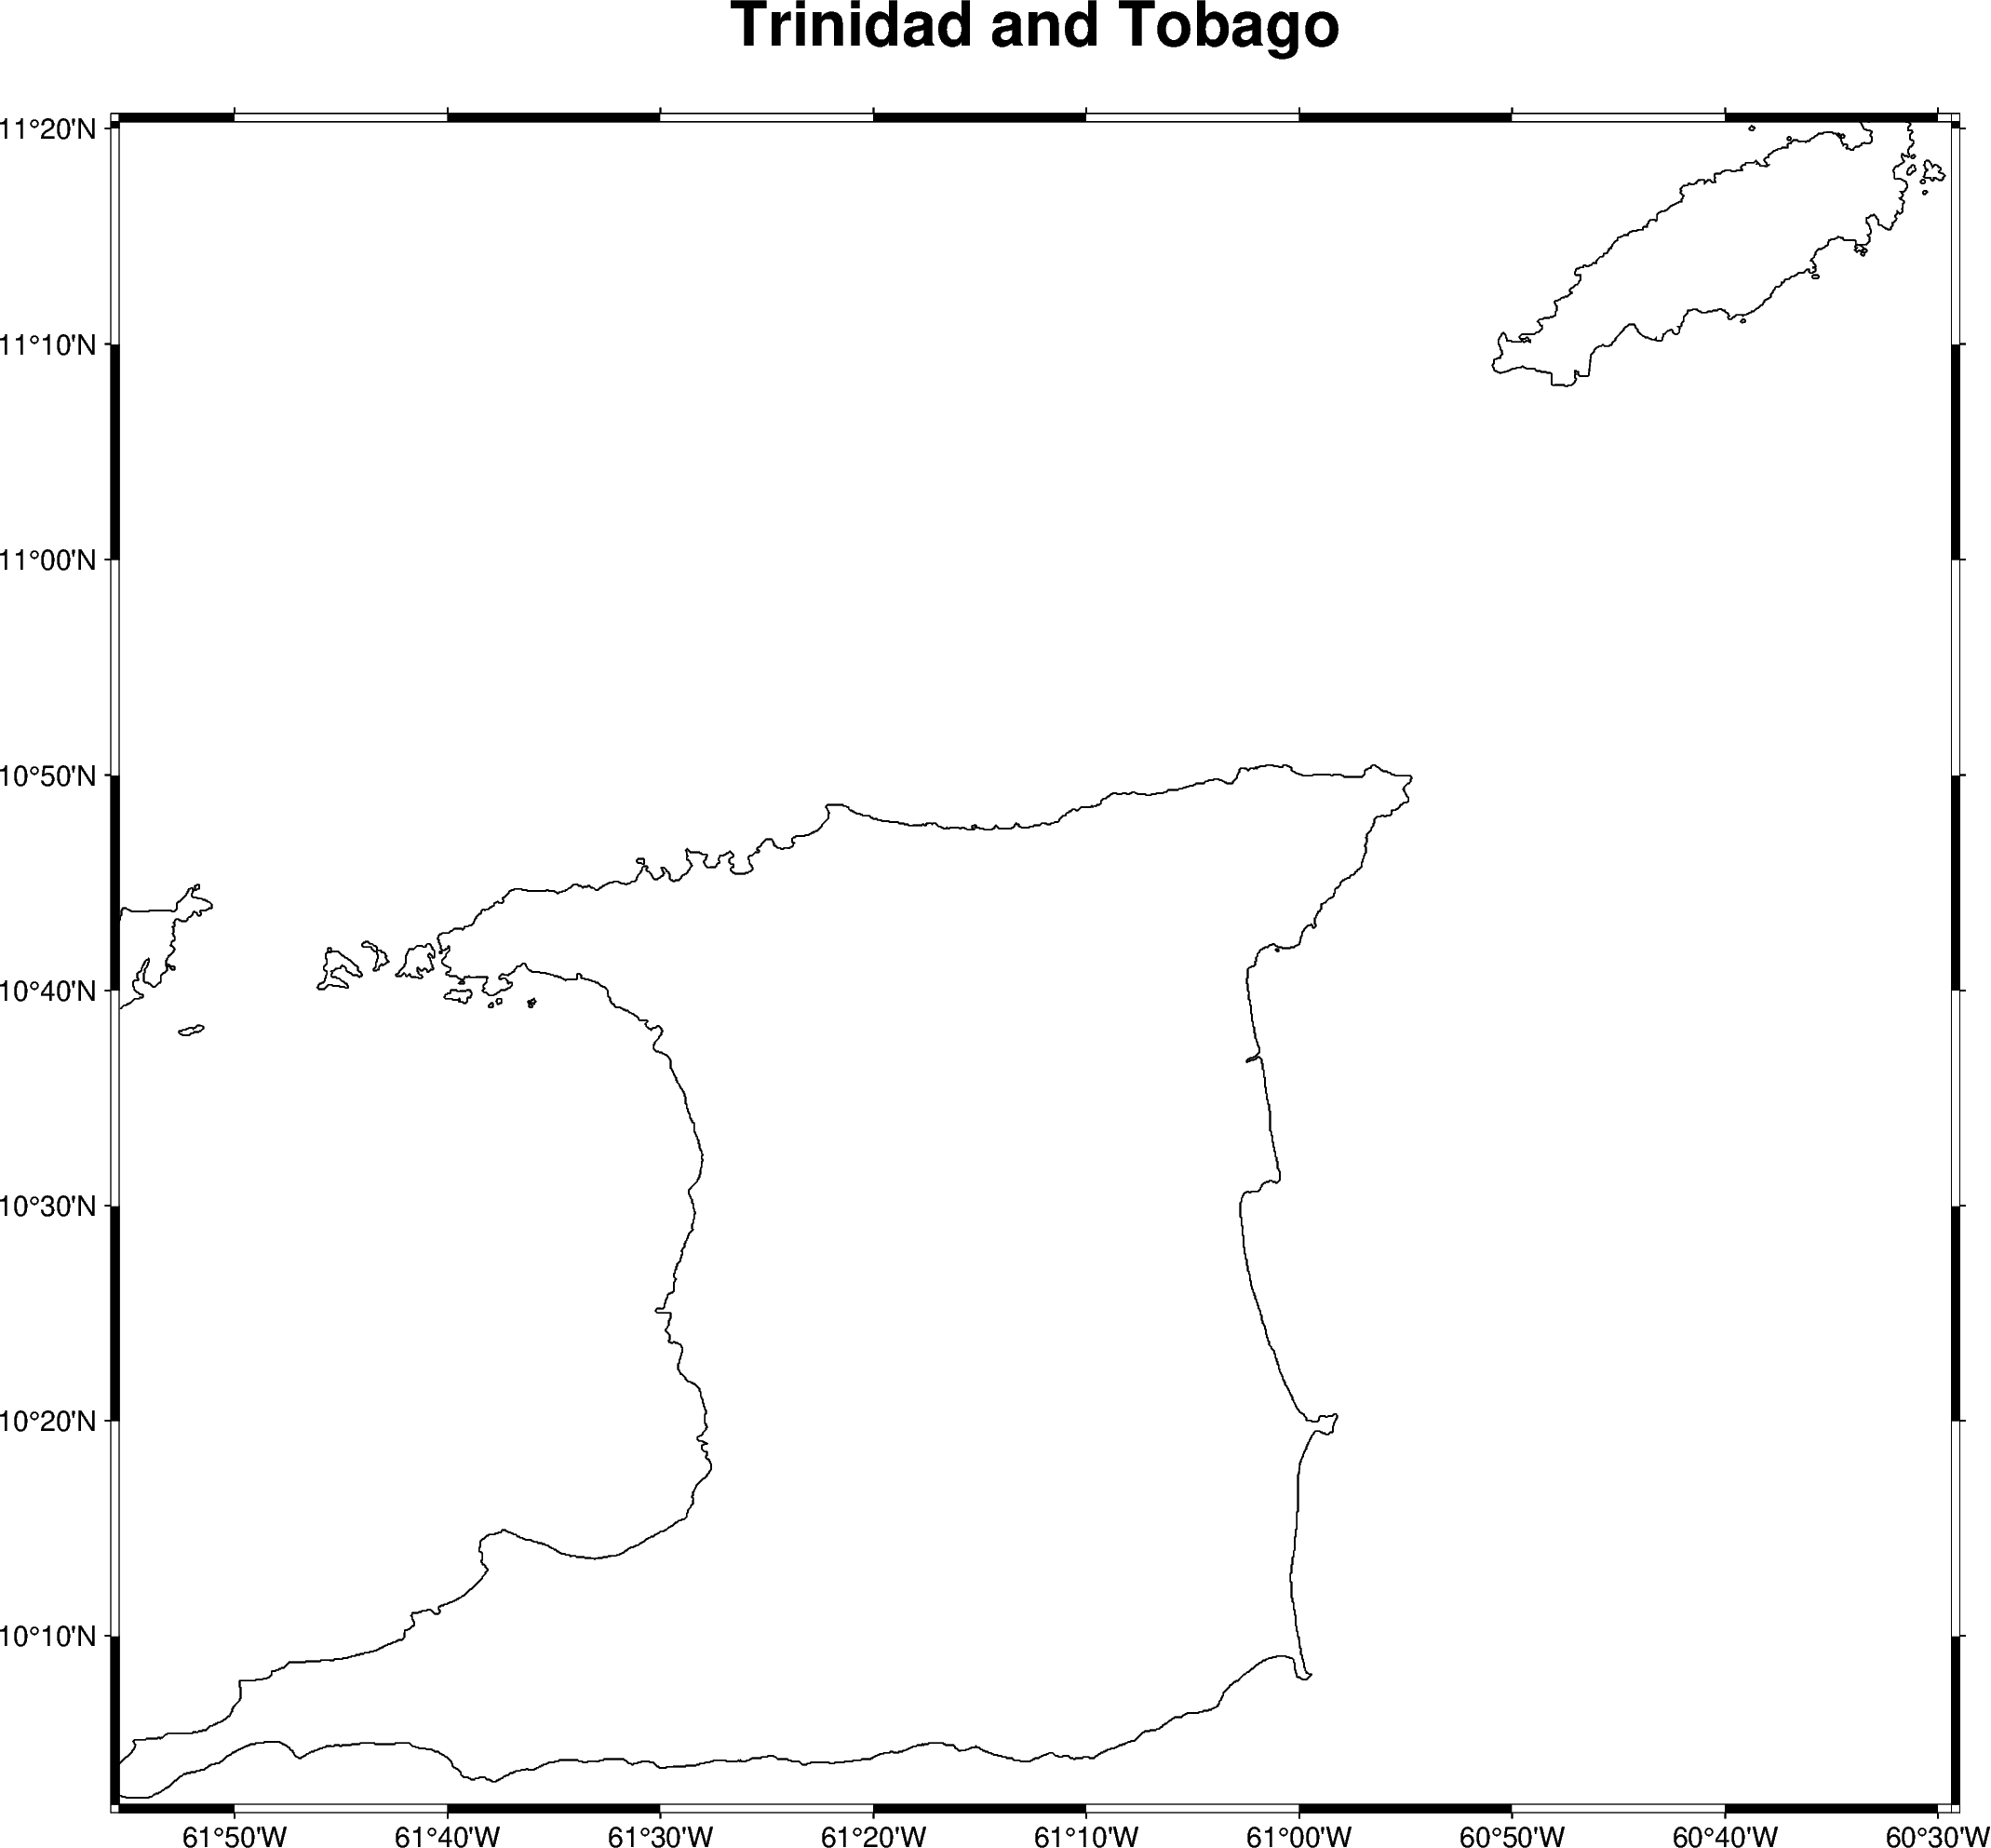
Title
The pygmt.params.Frame class lets us configure frame-wide settings such as
titles. Combine it with an Axis object to keep automatic annotations.
fig = pygmt.Figure()
# region="TT" specifies Trinidad and Tobago using the ISO country code
fig.coast(shorelines="1/0.5p", region="TT", projection="M15c")
fig.basemap(frame=Frame(title="Trinidad and Tobago", axis=Axis(annot=True)))
fig.show()
Axis labels
Axis labels, in GMT simply called labels, can be set through the xaxis and
yaxis parameters of Frame. The map boundaries (or plot axes) are named as
West/west/left (W, w, l), South/south/bottom (S, s, b),
North/north/top (N, n, t), and East/east/right (E, e, r) sides
of a figure. Uppercase letters (W, S, N, E) draw axes with annotations
and tick marks, lowercase letters (w, s, n, e) draw axes with tick
marks only, and l, b, t, r draw plain axis lines without ticks or
annotations. A frame like Frame(axes="WS") draws annotated west and south axes
only.
The example below uses a Cartesian projection, as GMT does not allow labels to be set for geographic maps.
fig = pygmt.Figure()
fig.basemap(
    region=[0, 10, 0, 20],
    projection="X10c/8c",
    # Plot axis with tick marks, annotations, and labels on the West and South axes.
    # Plot axis with tick marks on the north and east axes
    frame=Frame(
        axes="WSne",
        xaxis=Axis(annot=True, tick=True, label="x-axis"),
        yaxis=Axis(annot=True, tick=True, label="y-axis"),
    ),
)
fig.show()
Total running time of the script: (0 minutes 1.203 seconds)