Note
Go to the end to download the full example code.
Plotting text
It is often useful to add text annotations to a plot. This is handled by the
pygmt.Figure.text method of the pygmt.Figure class.
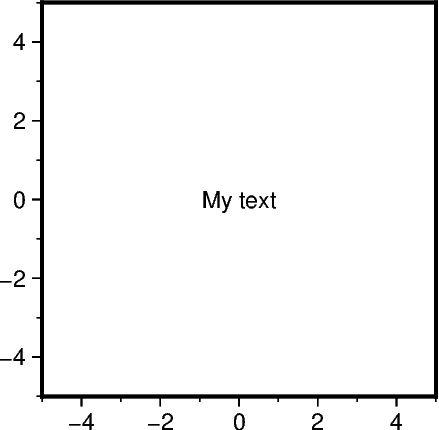
Adding a single text label
To add a single text label to a plot, use the text and x and y parameters
to specify the text and position.
fig = pygmt.Figure()
fig.basemap(region=[-5, 5, -5, 5], projection="X5c", frame=True)
fig.text(x=0, y=0, text="My text")
fig.show()
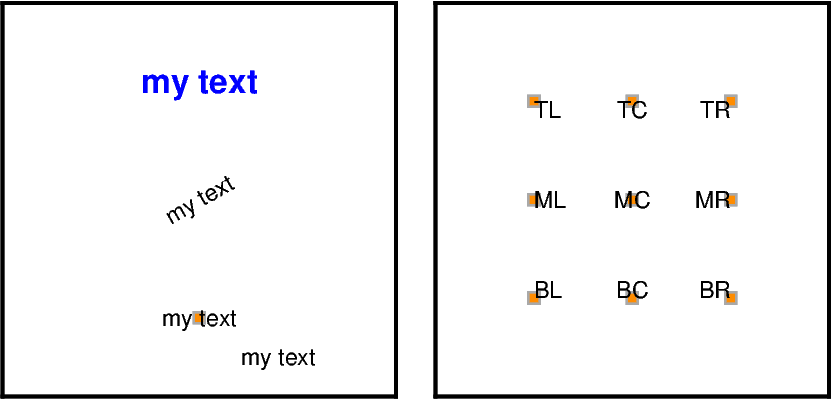
Adjusting the text label
There are several optional parameters to adjust the text label:
font: Sets the size, family/weight, and color of the font for the text. A list of all recognized fonts can be found at Supported Fonts. For details of how to use non-default fonts, refer to PostScript Fonts Used by GMT.angle: Specifies the rotation of the text. It is measured counter-clockwise from the horizontal in degrees.justify: Defines the anchor point of the bounding box for the text. It is specified by a 2-character justification code.offset: Shifts the text relatively to the reference point.
fig = pygmt.Figure()

# -----------------------------------------------------------------------------
# Left: "font", "angle", and "offset" parameters
fig.basemap(region=[-5, 5, -5, 5], projection="X5c", frame=Frame(axes="rtlb"))

# Change font size, family/weight, color of the text
fig.text(x=0, y=3, text="my text", font="12p,Helvetica-Bold,blue")

# Rotate the text by 30 degrees counter-clockwise from the horizontal
fig.text(x=0, y=0, text="my text", angle=30)

# Plot marker and text label for reference
fig.plot(x=0, y=-3, style="s0.2c", fill="darkorange", pen="0.7p,darkgray")
fig.text(x=0, y=-3, text="my text")
# Shift the text label relatively to the position given via the x and y parameters
# by 1 centimeter to the right (positive x-direction) and 0.5 centimeters down
# (negative y-direction)
fig.text(x=0, y=-3, text="my text", offset=(1, -0.5))

fig.shift_origin(xshift="w+0.5c")

# -----------------------------------------------------------------------------
# Right: "justify" parameter
fig.basemap(region=[-1, 1, -1, 1], projection="X5c", frame=Frame(axes="rtlb"))

# Plot markers for reference
fig.plot(
    x=[-0.5, 0, 0.5, -0.5, 0, 0.5, -0.5, 0, 0.5],
    y=[0.5, 0.5, 0.5, 0, 0, 0, -0.5, -0.5, -0.5],
    style="s0.2c",
    fill="darkorange",
    pen="0.7p,darkgray",
)

# Plot text labels at the x and y positions of the markers while varying the anchor
# point via the justify parameter
fig.text(x=-0.5, y=0.5, text="TL", justify="TL")  # Top Left
fig.text(x=0, y=0.5, text="TC", justify="TC")  # Top Center
fig.text(x=0.5, y=0.5, text="TR", justify="TR")  # Top Right
fig.text(x=-0.5, y=0, text="ML", justify="ML")  # Middle Left
fig.text(x=0, y=0, text="MC", justify="MC")  # Middle Center
fig.text(x=0.5, y=0, text="MR", justify="MR")  # Middle Right
fig.text(x=-0.5, y=-0.5, text="BL", justify="BL")  # Bottom Left
fig.text(x=0, y=-0.5, text="BC", justify="BC")  # Bottom Center
fig.text(x=0.5, y=-0.5, text="BR", justify="BR")  # Bottom Right

fig.show()
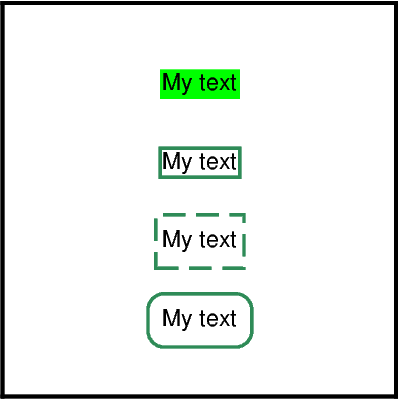
Adding a text box
There are different optional parameters to add and customize a text box:
fill: Fills the text box with a color.pen: Outlines the text box.clearance: Adds margins in x-and y-directions between the text and the outline of the text box. Can be used to get a text box with rounded edges.
fig = pygmt.Figure()

fig.basemap(region=[-5, 5, -5, 5], projection="X5c", frame=Frame(axes="rtlb"))

# Add a box with a fill in green color
fig.text(x=0, y=3, text="My text", fill="green")

# Add box with a seagreen, 1-point thick, solid outline
fig.text(x=0, y=1, text="My text", pen="1p,seagreen,solid")

# Add margins between the text and the outline of the text box of 0.1
# centimeters in x-direction and 0.2 centimeters in y-direction
fig.text(x=0, y=-1, text="My text", pen="1p,seagreen,dashed", clearance="0.1c/0.2c")

# Get rounded edges by passing "+tO" to the "clearance" parameter
fig.text(x=0, y=-3, text="My text", pen="1p,seagreen,solid", clearance="0.2c/0.2c+tO")

fig.show()
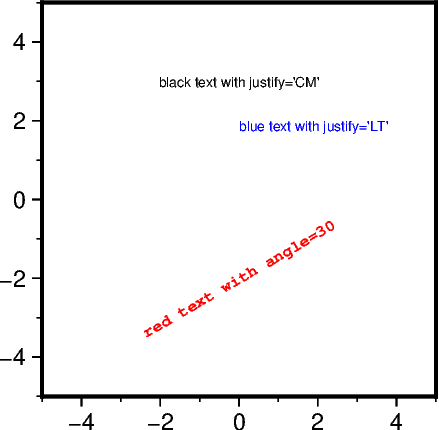
Adding multiple text labels with individual configurations
To add multiple text labels with individual font, angle, and justify,
one can provide lists with the corresponding arguments.
fig = pygmt.Figure()
fig.basemap(region=[-5, 5, -5, 5], projection="X5c", frame=True)

fig.text(
    x=[0, 0, 0],
    y=[3, 2, -2],
    font=["5p,Helvetica,black", "5p,Helvetica,blue", "6p,Courier-Bold,red"],
    angle=[0, 0, 30],
    justify=["CM", "LT", "CM"],
    text=[
        "black text with justify='CM'",
        "blue text with justify='LT'",
        "red text with angle=30",
    ],
)

fig.show()
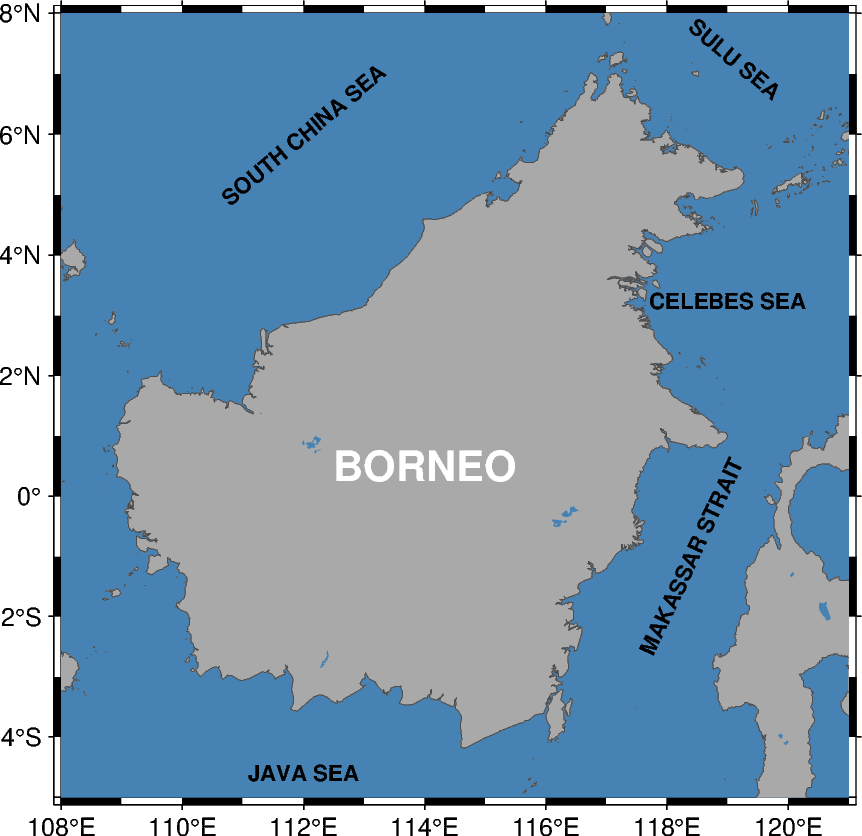
Using an external input file
It is also possible to add text labels via an external input file containing x,
y, and text columns. Addionaly, columns to set the angle, front,
and justify parameters can be provided. Here, we give a complete example.
fig = pygmt.Figure()
fig.basemap(region=[108, 121, -5, 8], projection="M10c", frame=Axis(annot=2, tick=1))
fig.coast(land="darkgray", water="steelblue", shorelines="1/0.1p,gray30")

# Create space-delimited file with region / sea names:
# - longitude (x) and latitude (y) coordinates are in the first two columns
# - angle, font, and justify muss be present in this order in the next three columns
# - the text to be printed is given in the last column
with Path.open("examples.txt", "w") as f:
    f.write("114.00  0.50   0 15p,Helvetica-Bold,white CM BORNEO\n")
    f.write("119.00  3.25   0  8p,Helvetica-Bold,black CM CELEBES SEA\n")
    f.write("112.00 -4.60   0  8p,Helvetica-Bold,black CM JAVA SEA\n")
    f.write("112.00  6.00  40  8p,Helvetica-Bold,black CM SOUTH CHINA SEA\n")
    f.write("119.12  7.25 -40  8p,Helvetica-Bold,black CM SULU SEA\n")
    f.write("118.40 -1.00  65  8p,Helvetica-Bold,black CM MAKASSAR STRAIT\n")

# Setting the angle, font, and justify parameters to True indicates that those columns
# are present in the text file
fig.text(textfiles="examples.txt", angle=True, font=True, justify=True)

# Cleanups
Path("examples.txt").unlink()

fig.show()
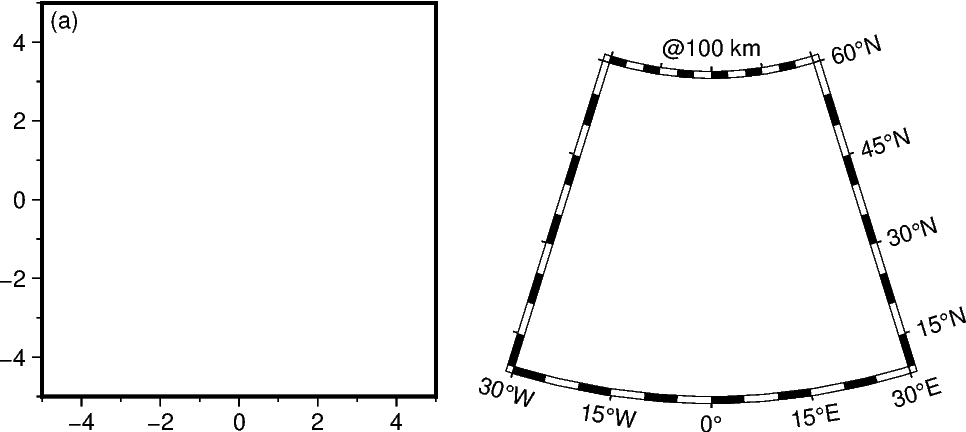
Using the position parameter
Instead of using the x and y parameters, the position parameter can be
specified to set the reference point for the text on the plot. As for the justify
parameter, the position parameter is specified by a
2-character justification code.
This can be helpful to add a tag to a subplot or text labels out of the plot
frame, e.g., for depth slices.
fig = pygmt.Figure()

# -----------------------------------------------------------------------------
# Left: Add a tag to a subplot at the Top Left corner
fig.basemap(
    region=[-5, 5, -5, 5],
    projection="X5c",
    frame=Frame(axes="WStr", axis=Axis(annot=True, tick=True)),
)
fig.text(text="(a)", position="TL", justify="TL", offset=(0.1, -0.1))

fig.shift_origin(xshift="w+1c")

# -----------------------------------------------------------------------------
# Right: Add a text label outside of the plot frame
fig.basemap(
    region=[-30, 30, 10, 60],
    projection="L0/35/23/47/5c",
    frame=Frame(axes="wSnE", axis=Axis(annot=True, tick=True)),
)

fig.text(
    text="@@100 km",  # "@@" gives "@" in GMT or PyGMT
    position="TC",  # Top Center
    justify="MC",  # Middle Center
    offset=(0, 0.2),
    no_clip=True,  # Allow plotting outside of the plot frame
)

fig.show()
Advanced configuration
For crafting more advanced styles, including using special symbols and other character sets, be sure to check out the GMT documentation at https://docs.generic-mapping-tools.org/6.6/text.html and also the Technical References at https://docs.generic-mapping-tools.org/6.6/reference/features.html#placement-of-text. Good luck!
Total running time of the script: (0 minutes 0.779 seconds)