Note
Click here to download the full example code
Creating a map with contour lines
Plotting a contour map is handled by pygmt.Figure.grdcontour.
Note
This tutorial assumes the use of a Python notebook, such as IPython or Jupyter Notebook.
To see the figures while using a Python script instead, use
fig.show(method="external) to display the figure in the default PDF viewer.
To save the figure, use fig.savefig("figname.pdf") where "figname.pdf"
is the desired name and file extension for the saved figure.
import pygmt

# Load sample earth relief data
grid = pygmt.datasets.load_earth_relief(resolution="05m", region=[-92.5, -82.5, -3, 7])
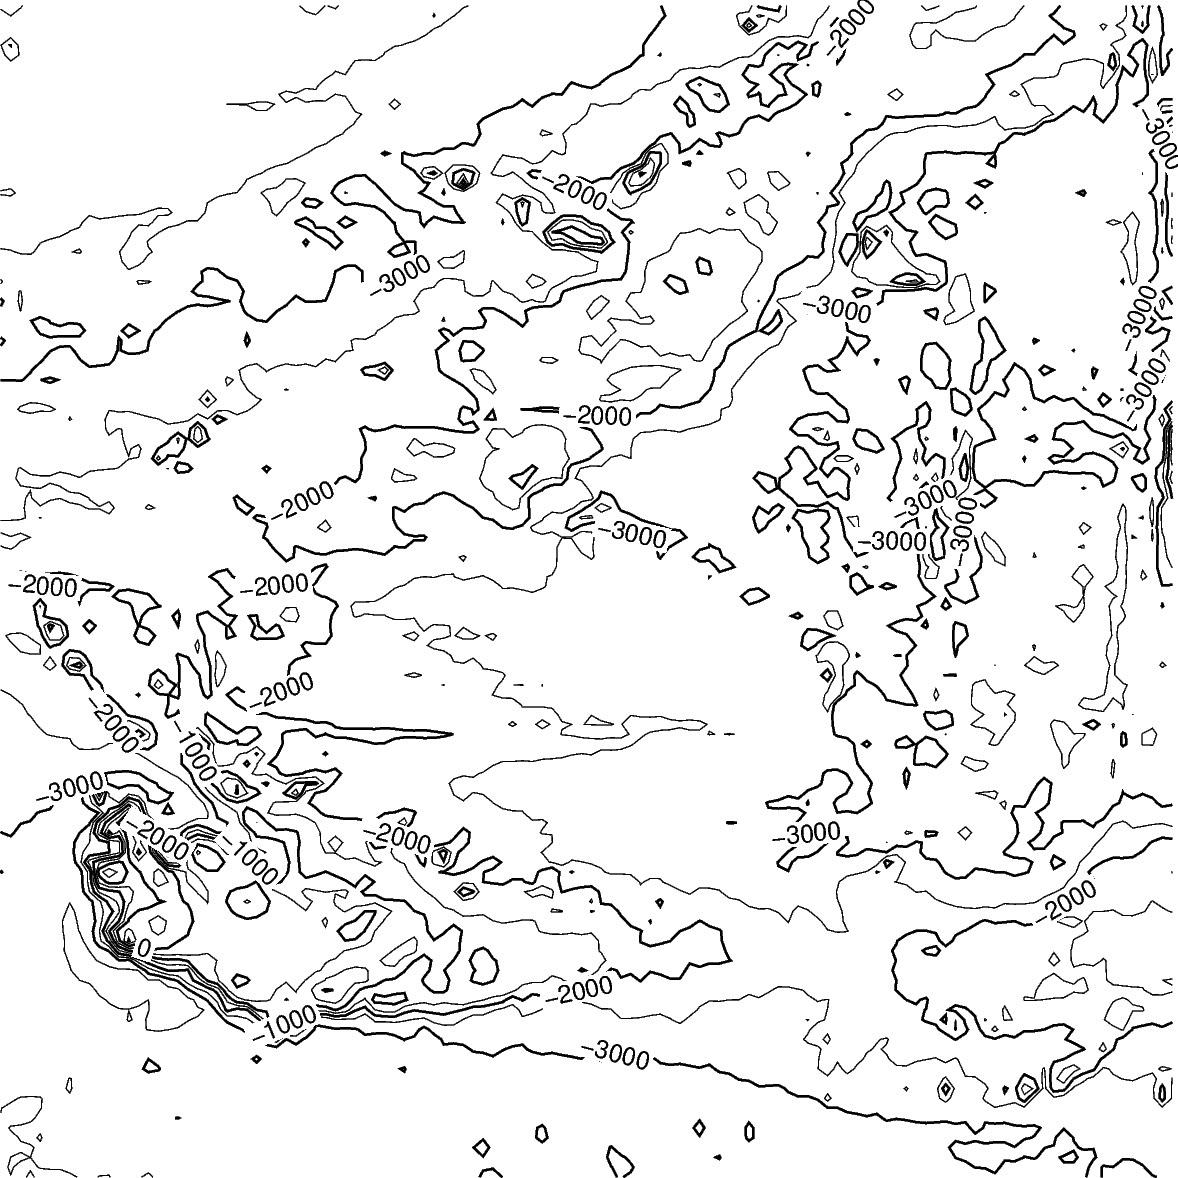
Create contour plot
The pygmt.Figure.grdcontour method takes the grid input.
It plots annotated contour lines, which are thicker and have the
elevation/depth written on them, and unannotated contour lines.
In the example below, the default contour line intervals are 500 meters,
with an annotated contour line every 1000 meters.
By default, it plots the map with the
equidistant cylindrical projection and with no frame.
fig = pygmt.Figure()
fig.grdcontour(grid=grid)
fig.show()
Out:
<IPython.core.display.Image object>
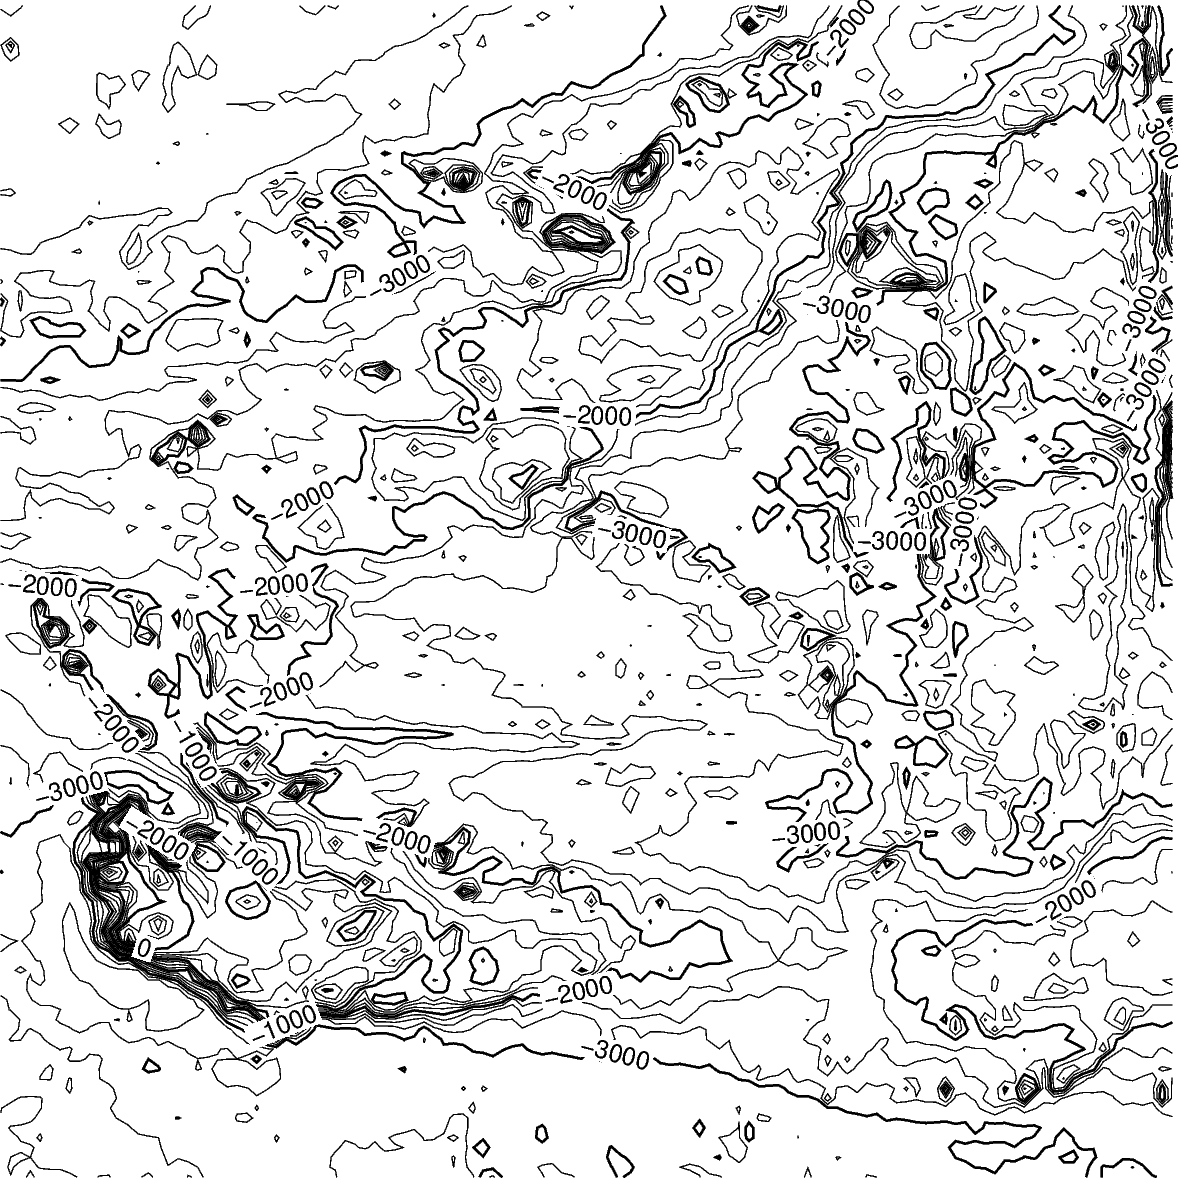
Contour line settings
Use the annotation and interval arguments to adjust contour line intervals.
In the example below, there are contour intervals every 250 meters and
annotated contour lines every 1,000 meters.
fig = pygmt.Figure()
fig.grdcontour(
    annotation=1000,
    interval=250,
    grid=grid,
)
fig.show()
Out:
<IPython.core.display.Image object>
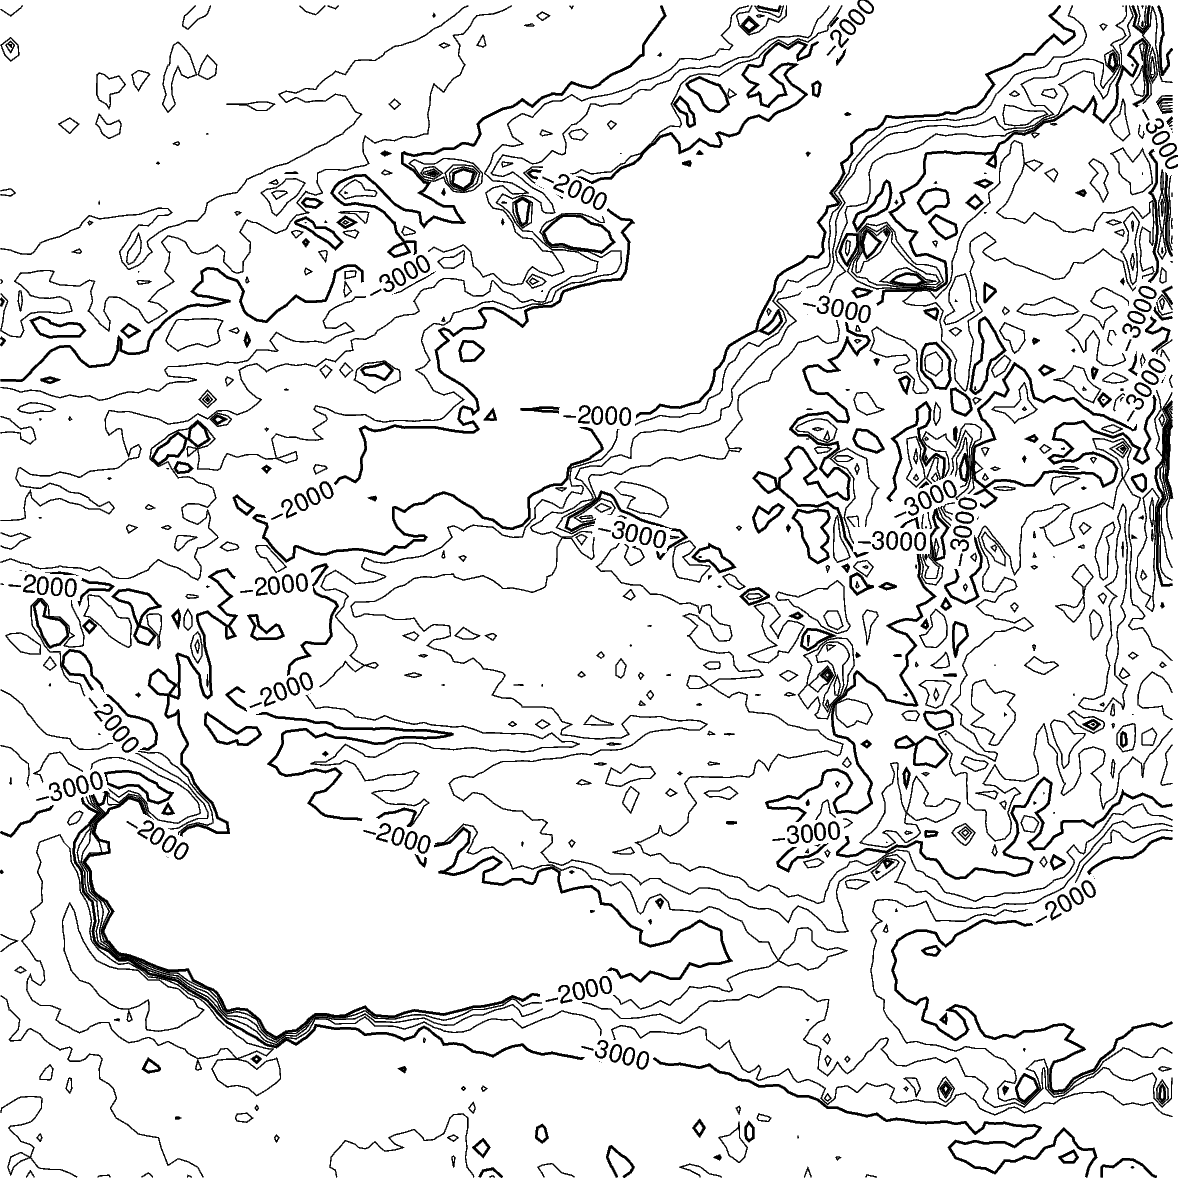
Contour limits
The limit argument sets the minimum and maximum values for the contour lines.
The argument takes the low and high values,
and is either a list (as below) or a string limit="-4000/-2000".
fig = pygmt.Figure()
fig.grdcontour(
    annotation=1000,
    interval=250,
    grid=grid,
    limit=[-4000, -2000],
)
fig.show()
Out:
<IPython.core.display.Image object>
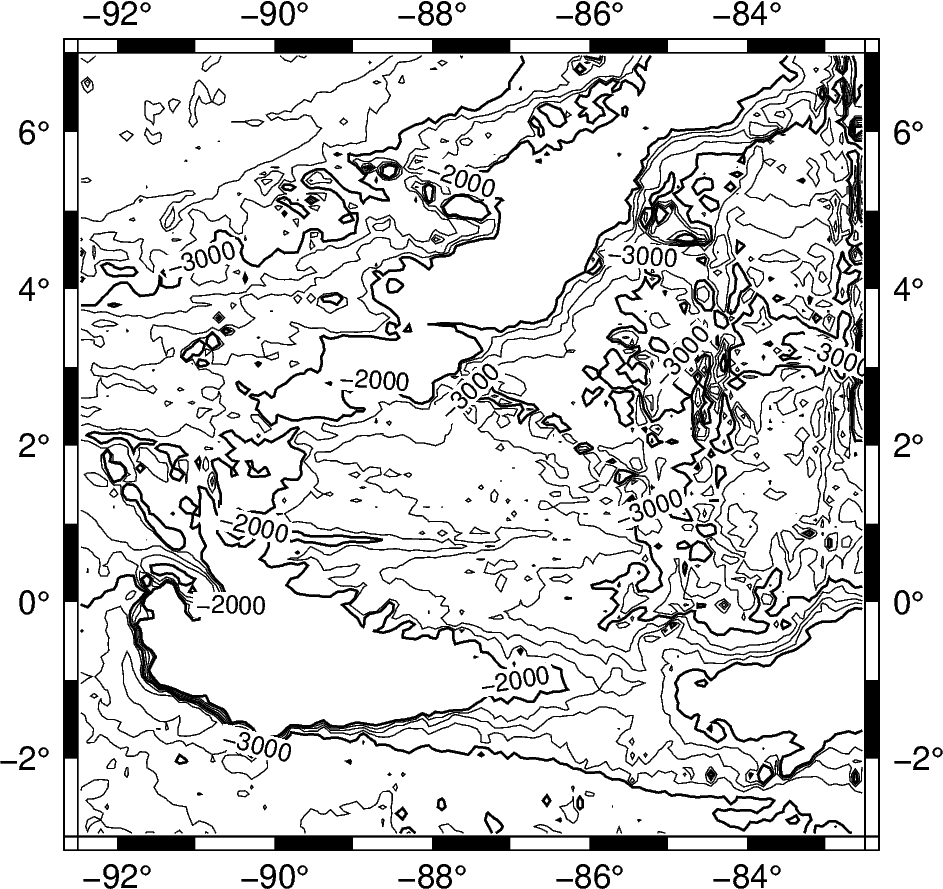
Map settings
The pygmt.Figure.grdcontour method accepts additional arguments,
including setting the projection and frame.
fig = pygmt.Figure()
fig.grdcontour(
    annotation=1000,
    interval=250,
    grid=grid,
    limit=[-4000, -2000],
    projection="M10c",
    frame=True,
)
fig.show()
Out:
<IPython.core.display.Image object>
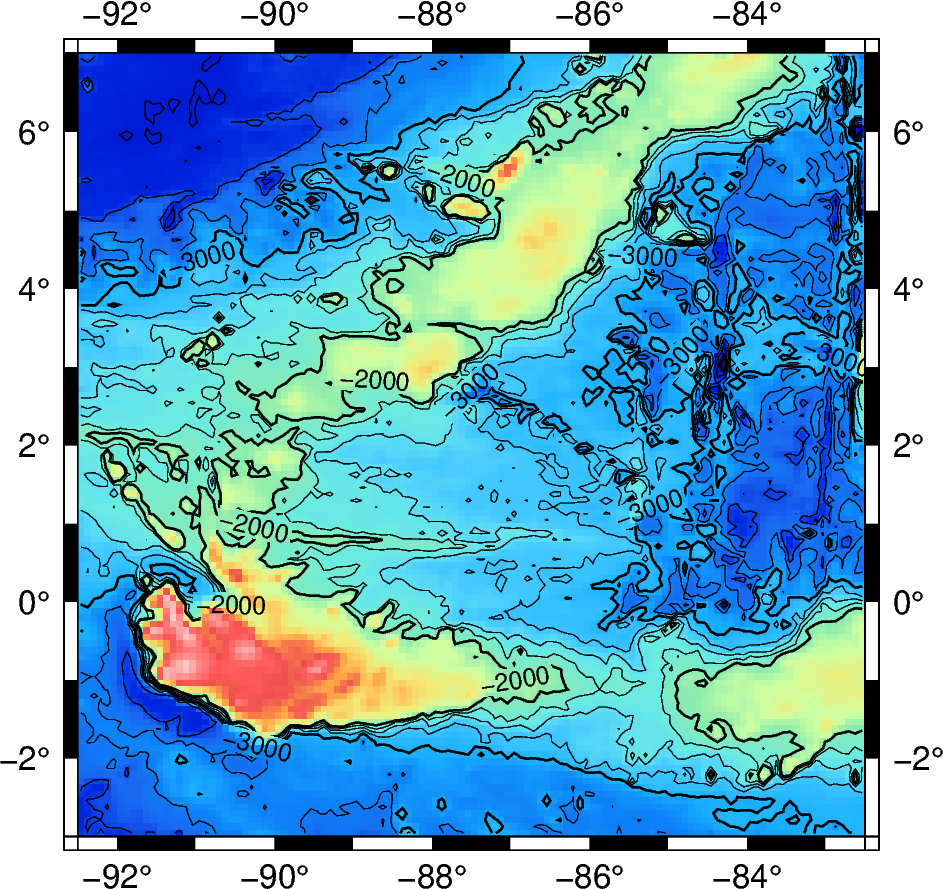
Adding a colormap
The pygmt.Figure.grdimage method can be used to add a
colormap to the contour map. It must be called prior to
pygmt.Figure.grdcontour to keep the contour lines visible on the final map.
If the projection argument is specified in the pygmt.Figure.grdimage
method, it does not need to be repeated in the pygmt.Figure.grdcontour method.
fig = pygmt.Figure()
fig.grdimage(
    grid=grid,
    cmap="haxby",
    projection="M10c",
    frame=True,
)
fig.grdcontour(
    annotation=1000,
    interval=250,
    grid=grid,
    limit=[-4000, -2000],
)
fig.show()
Out:
<IPython.core.display.Image object>
Total running time of the script: ( 0 minutes 8.041 seconds)