Note
Click here to download the full example code
Frames, ticks, titles, and labels
Setting the style of the map frames, ticks, etc, is handled by the frame argument
that all plotting methods of pygmt.Figure.
Note
This tutorial assumes the use of a Python notebook, such as IPython or Jupyter Notebook.
To see the figures while using a Python script instead, use
fig.show(method="external) to display the figure in the default PDF viewer.
To save the figure, use fig.savefig("figname.pdf") where "figname.pdf"
is the desired name and file extension for the saved figure.
import pygmt
Plot frame
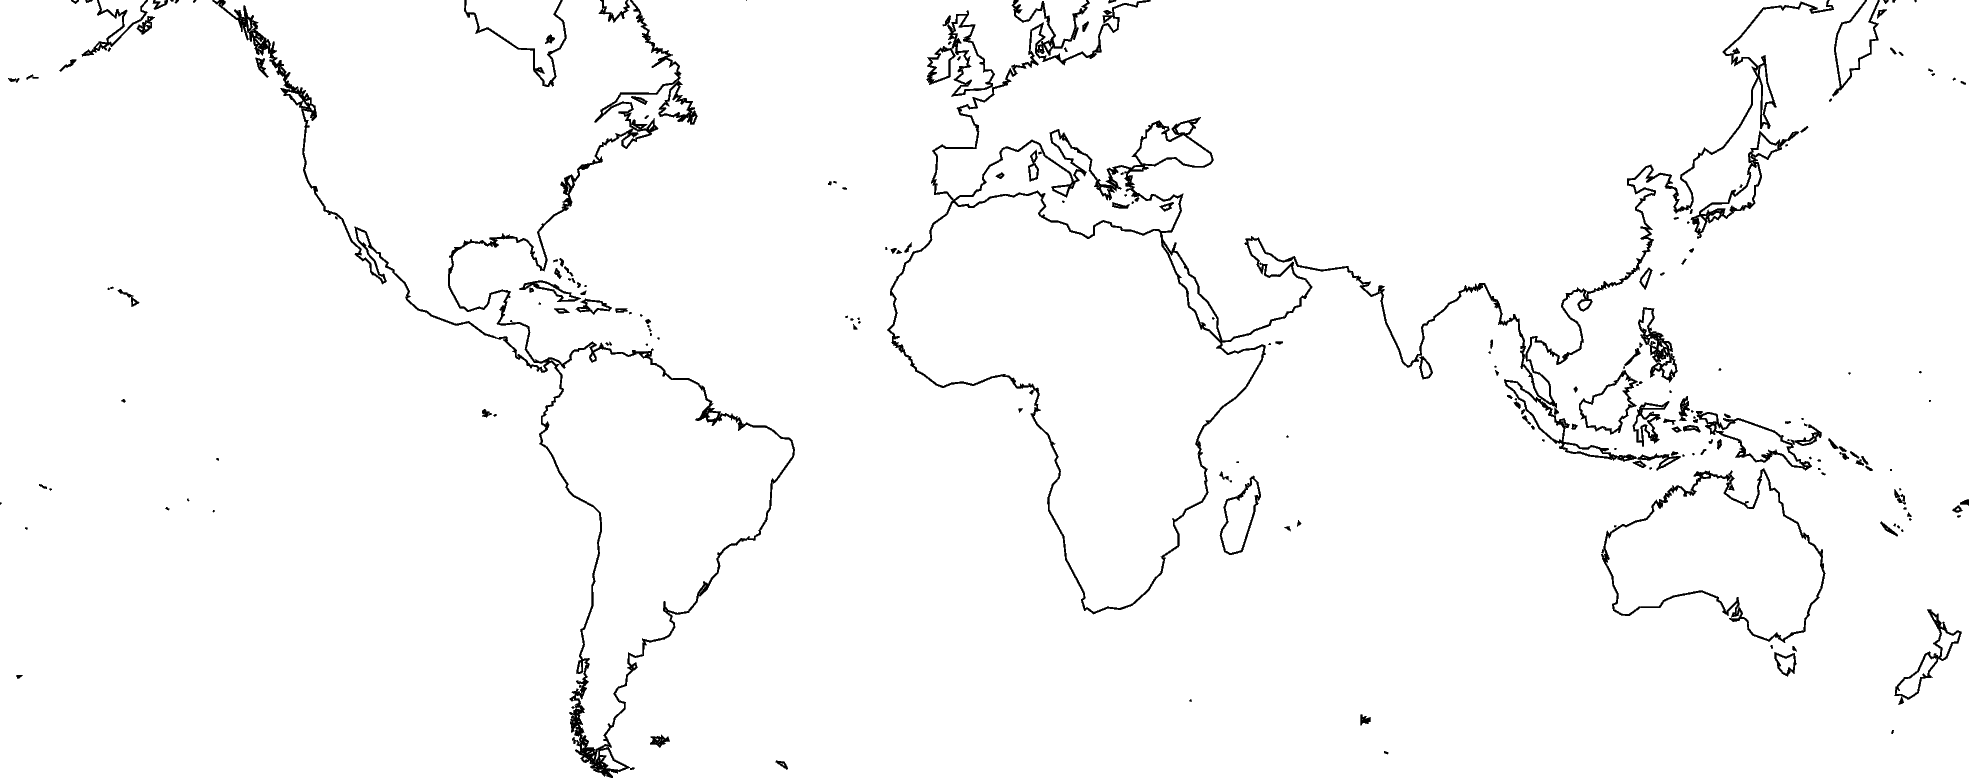
By default, PyGMT does not add a frame to your plot. For example, we can plot the coastlines of the world with a Mercator projection:
fig = pygmt.Figure()
fig.coast(shorelines="1/0.5p", region=[-180, 180, -60, 60], projection="M25c")
fig.show()
Out:
<IPython.core.display.Image object>
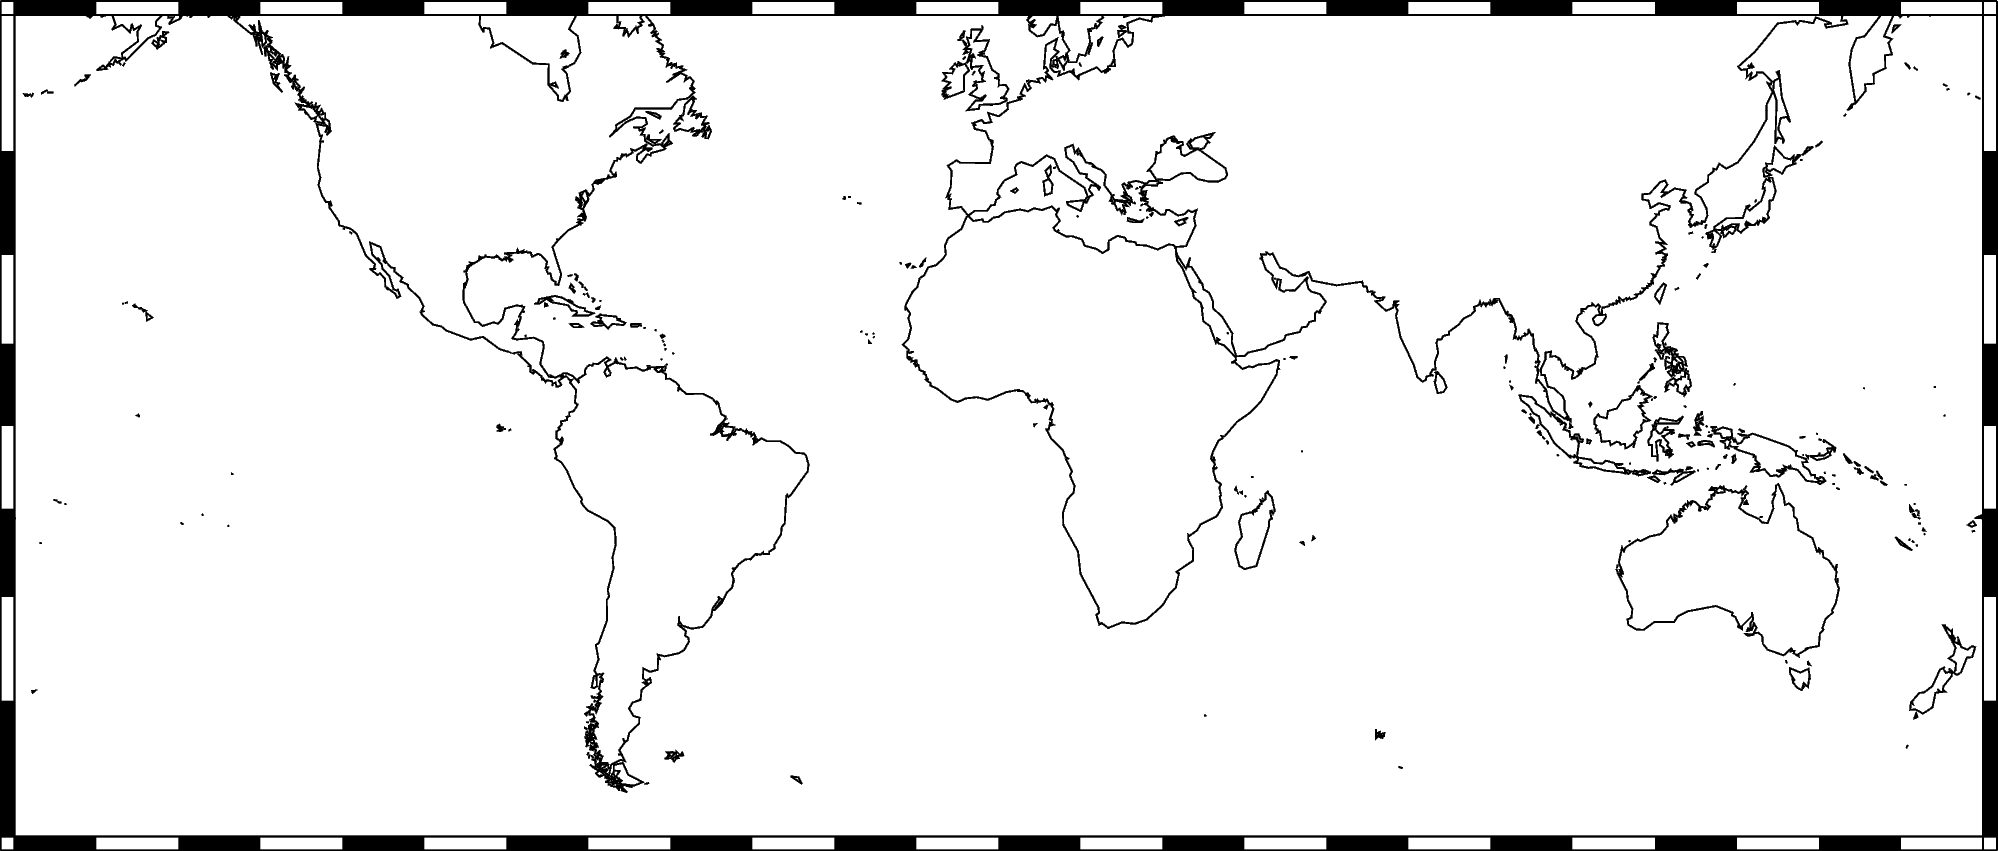
To add the default GMT frame to the plot, use frame="f" in
pygmt.Figure.basemap or any other plotting module:
fig = pygmt.Figure()
fig.coast(shorelines="1/0.5p", region=[-180, 180, -60, 60], projection="M25c")
fig.basemap(frame="f")
fig.show()
Out:
<IPython.core.display.Image object>
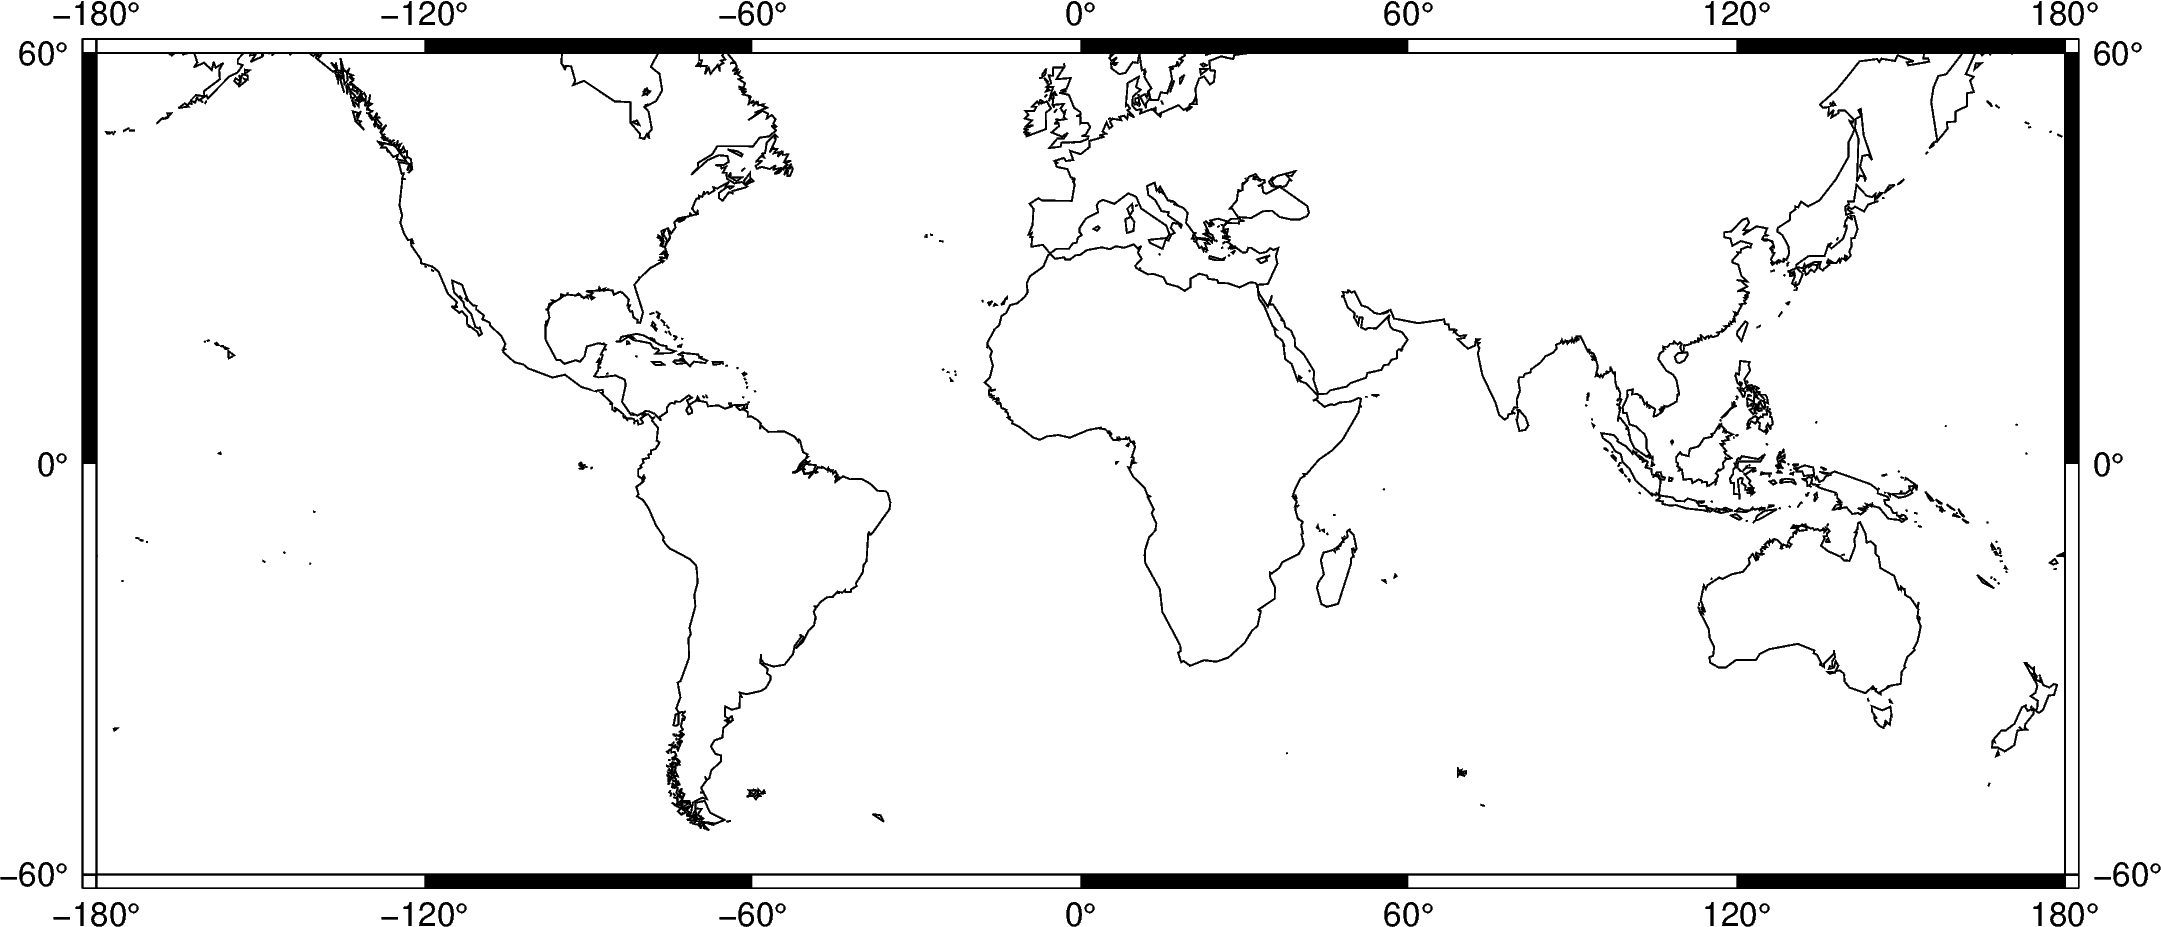
Ticks and grid lines
The automatic frame (frame=True or frame="a") sets the default GMT style frame
and automatically determines tick labels from the plot region.
fig = pygmt.Figure()
fig.coast(shorelines="1/0.5p", region=[-180, 180, -60, 60], projection="M25c")
fig.basemap(frame="a")
fig.show()
Out:
<IPython.core.display.Image object>
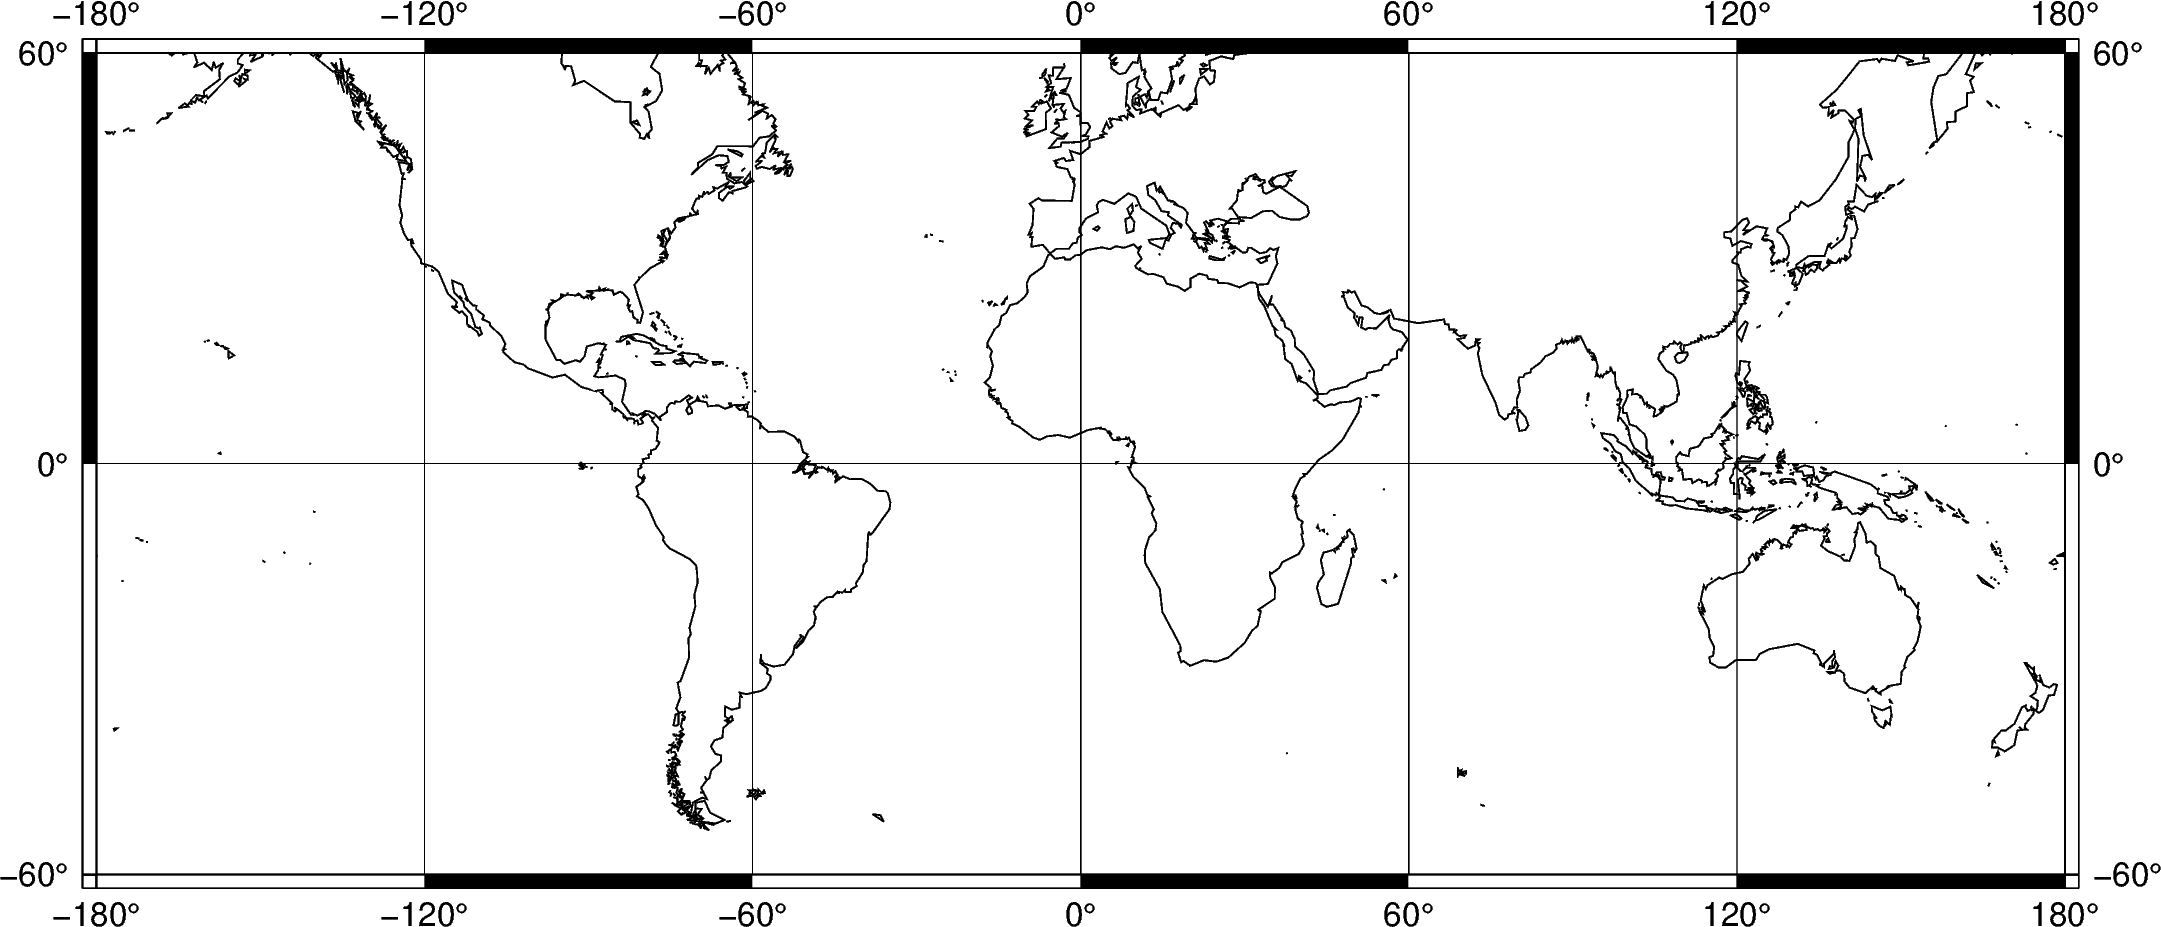
Add automatic grid lines to the plot by adding a g to frame:
fig = pygmt.Figure()
fig.coast(shorelines="1/0.5p", region=[-180, 180, -60, 60], projection="M25c")
fig.basemap(frame="ag")
fig.show()
Out:
<IPython.core.display.Image object>
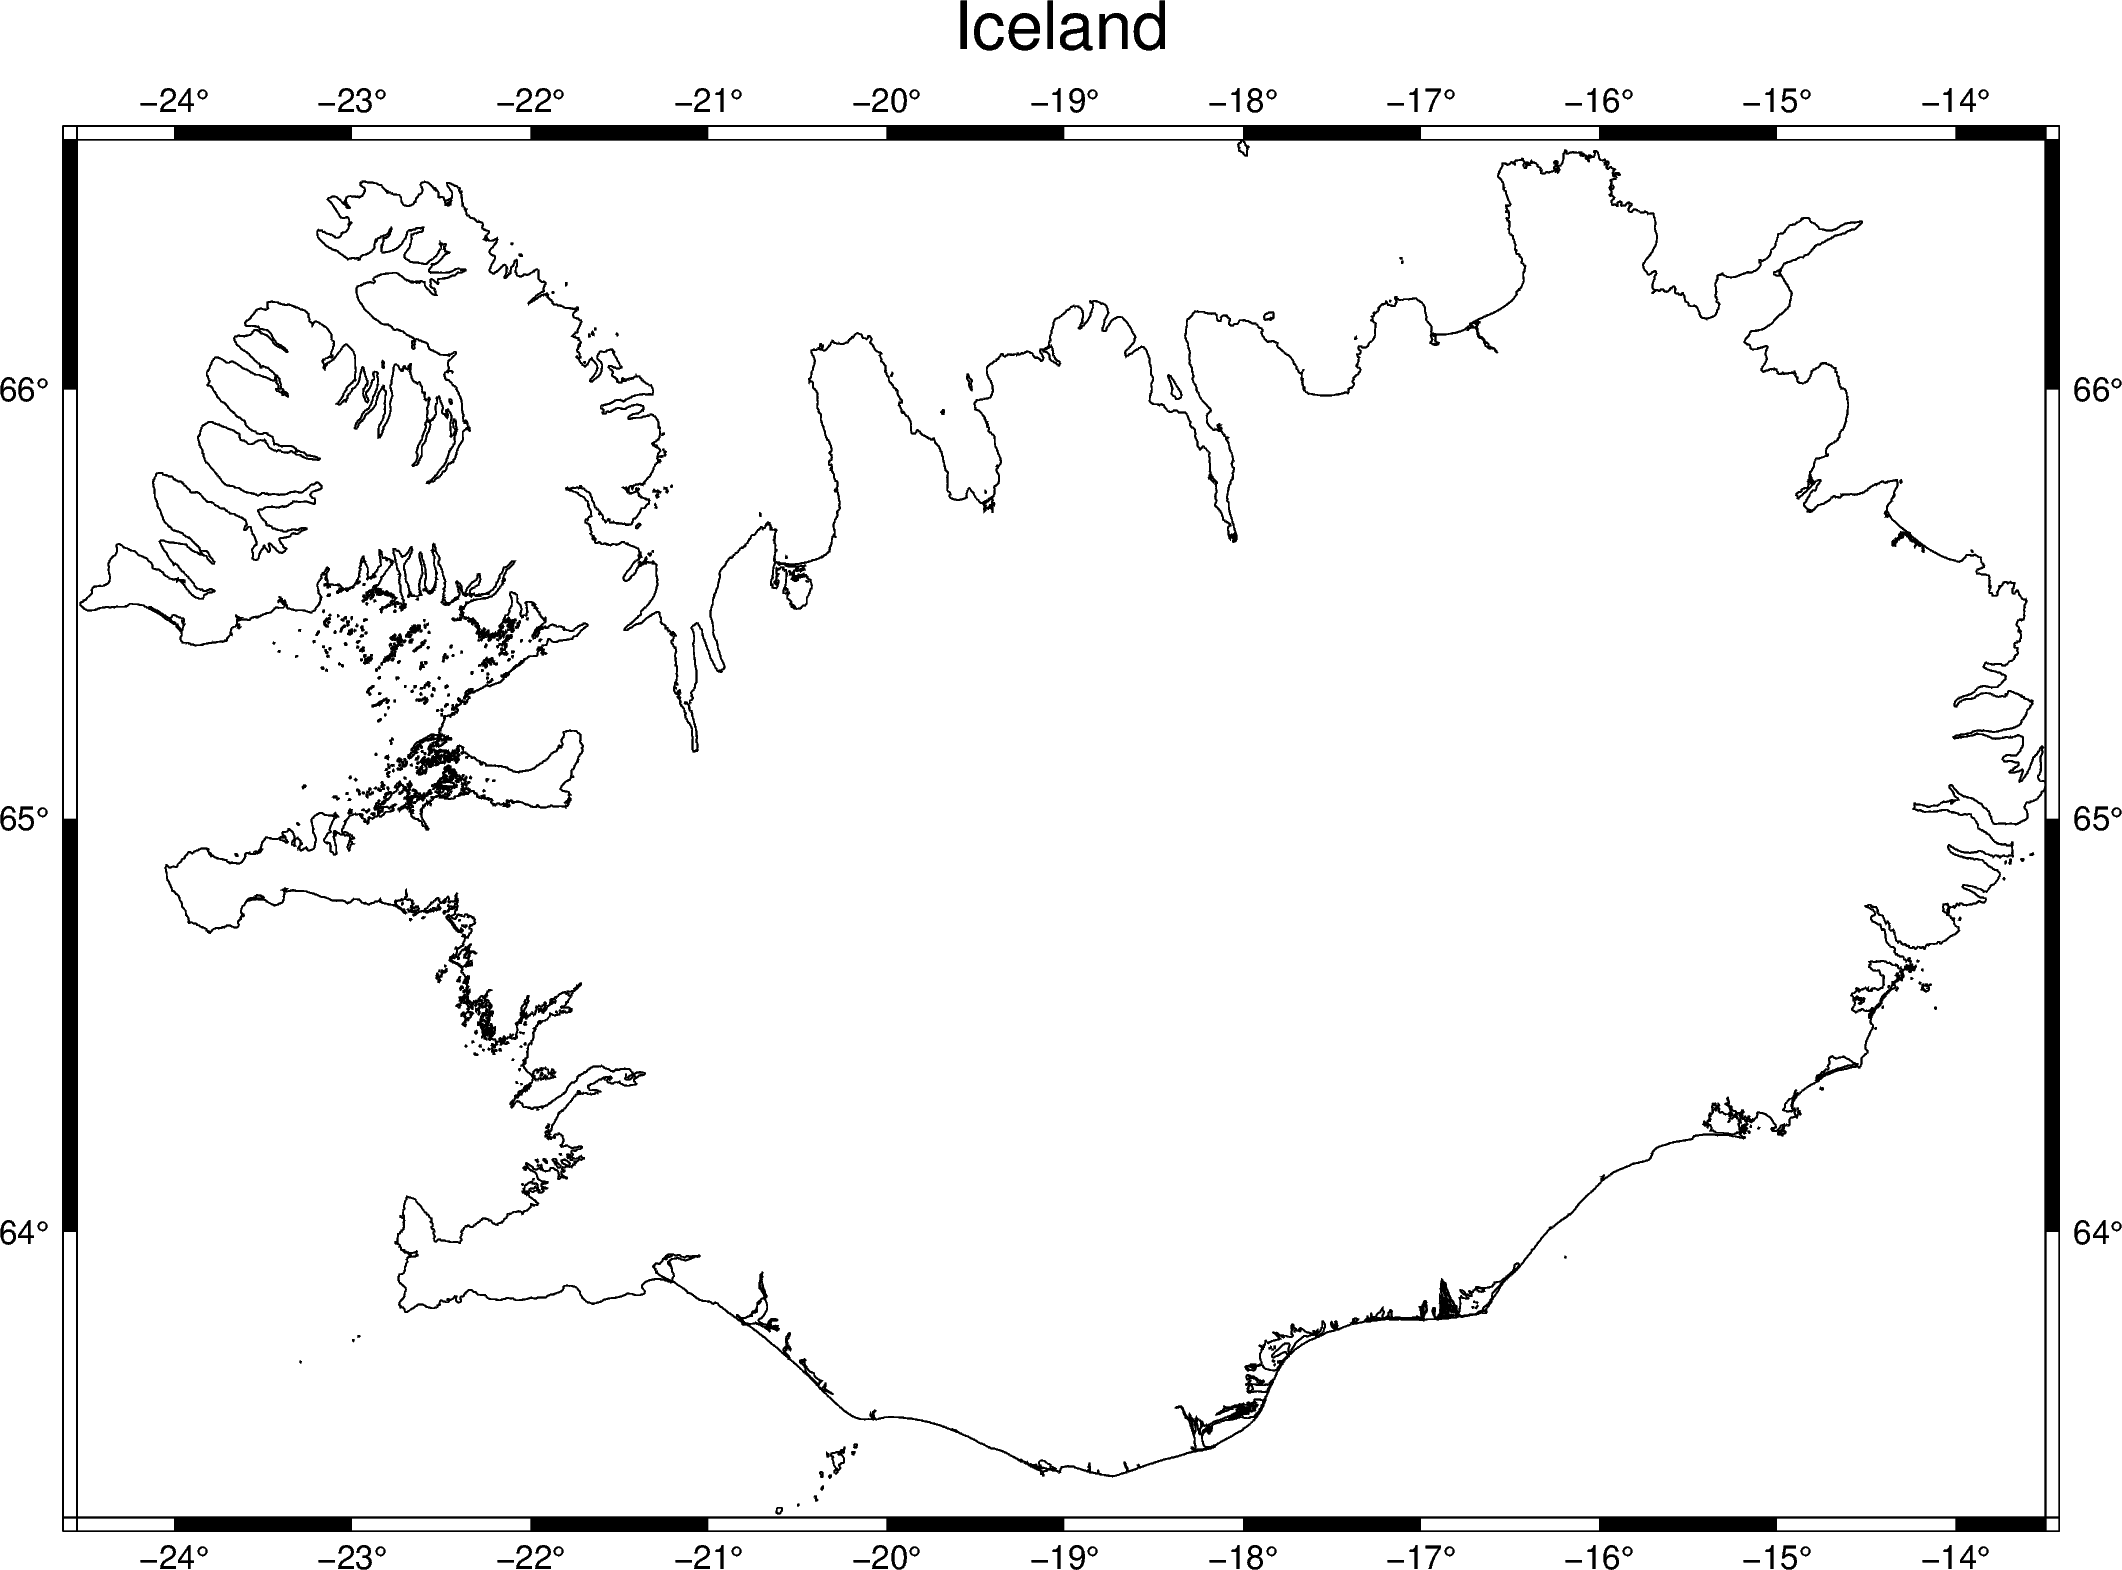
Title
The figure title can be set by passing +ttitle to the frame argument of
pygmt.Figure.basemap. Passing multiple arguments to frame can be done by
using a list, as show in the example below.
fig = pygmt.Figure()
# region="IS" specifies Iceland using the ISO country code
fig.coast(shorelines="1/0.5p", region="IS", projection="M25c")
fig.basemap(frame=["a", "+tIceland"])
fig.show()
Out:
<IPython.core.display.Image object>
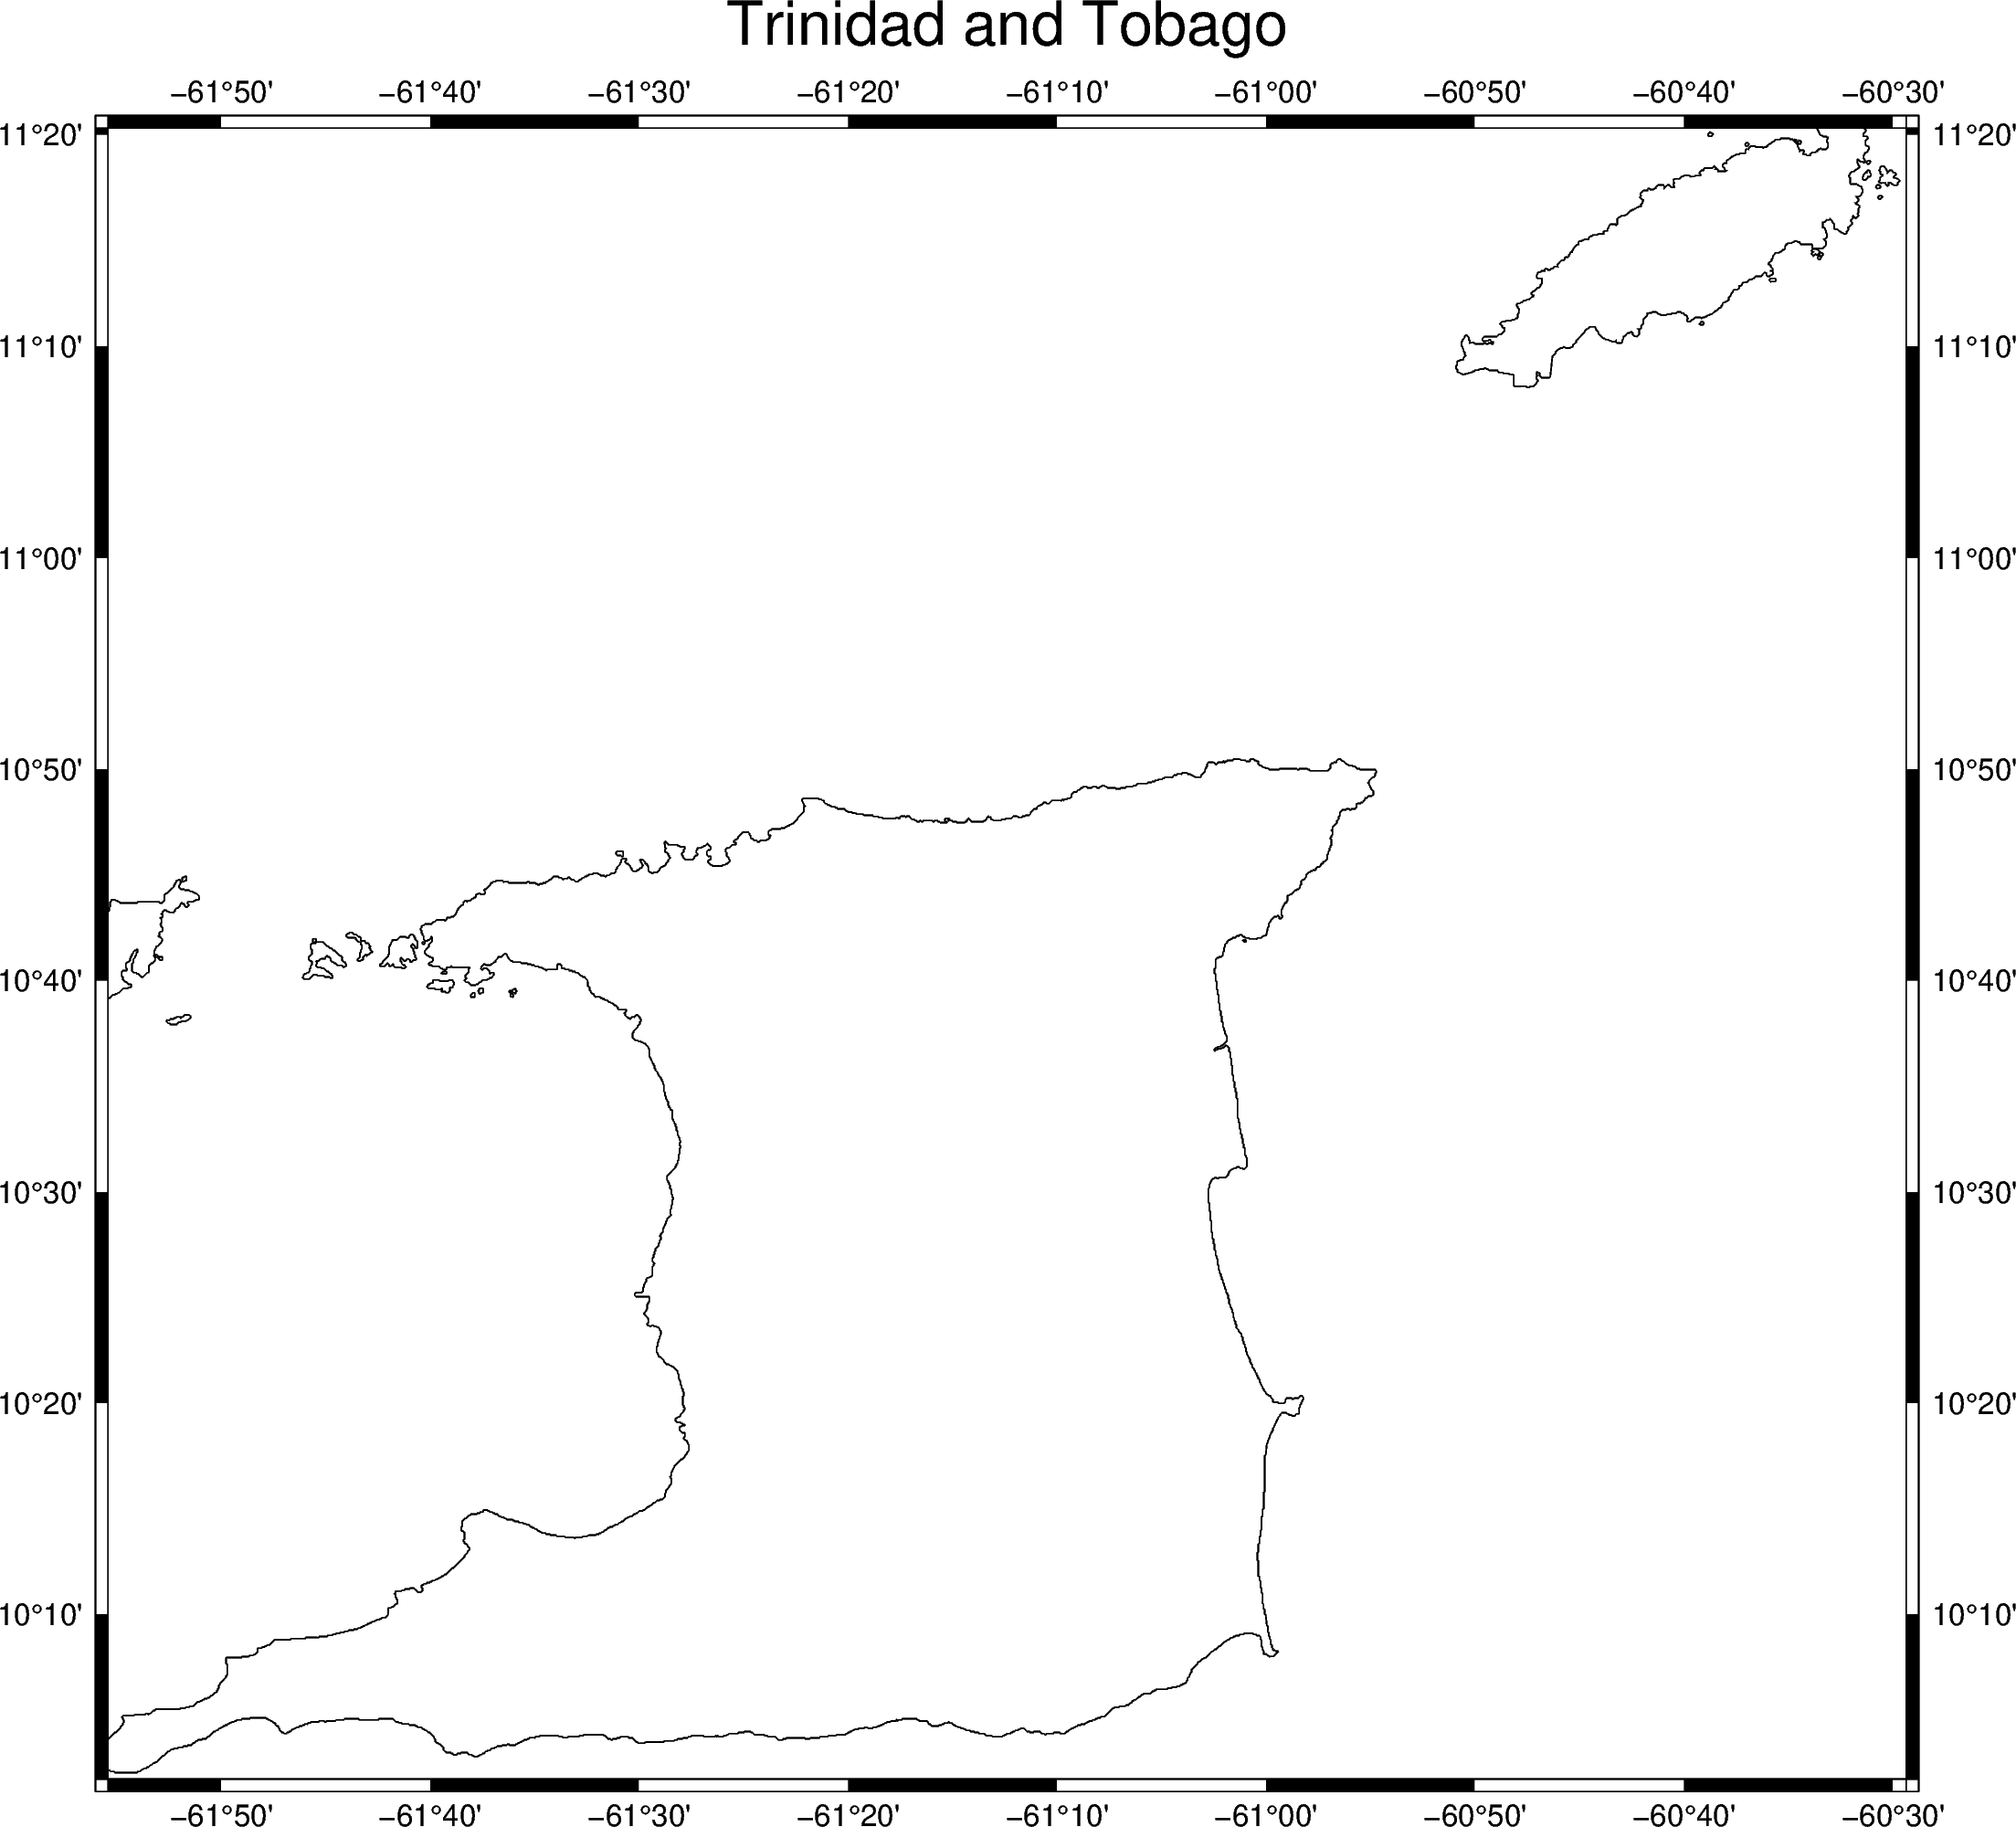
To use a title with multiple words, the title must be placed inside another set of
quotation marks. To prevent the quotation marks from appearing in the figure title,
the frame argument can be passed in single quotation marks and the title can be
passed in double quotation marks.
fig = pygmt.Figure()
# region="TT" specifies Trinidad and Tobago
fig.coast(shorelines="1/0.5p", region="TT", projection="M25c")
fig.basemap(frame=["a", '+t"Trinidad and Tobago"'])
fig.show()
Out:
<IPython.core.display.Image object>
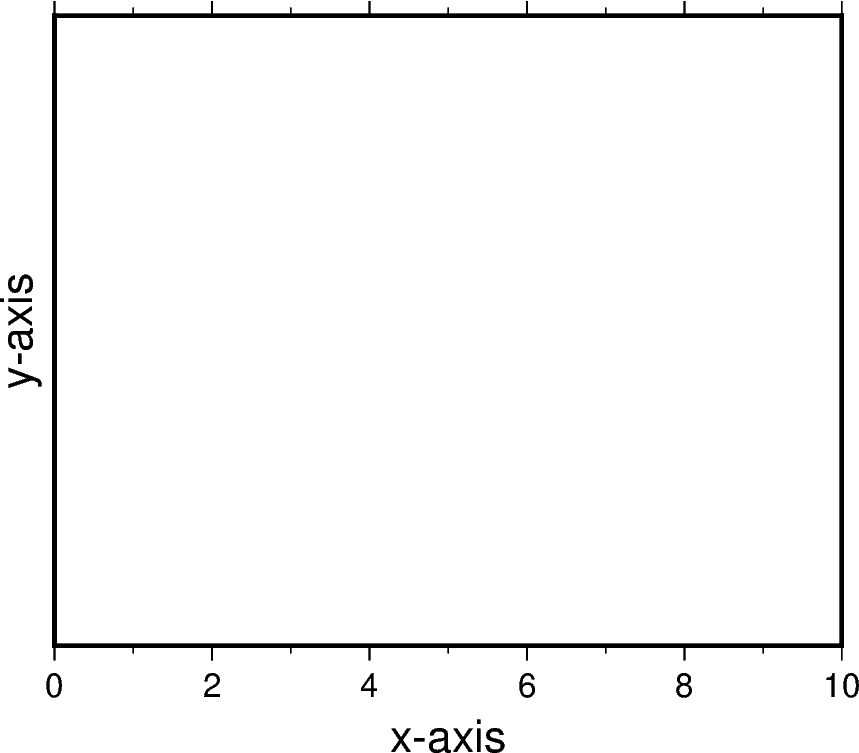
Axis labels
Axis labels can be set by passing x+llabel (or starting with y if
labeling the y-axis) to the frame argument of pygmt.Figure.basemap.
By default, all 4 map boundaries (or plot axes) are plotted with both tick marks and
axis labels. The axes are named as W (west/left), S (south/bottom),
N (north/top), and E (east/right) sides of a figure. If an upper-case axis
name is passed, the axis is plotted with tick marks and axis labels. A lower case
axis name plots only the axis and tick marks.
The example below uses a Cartesian projection, as GMT does not allow axis labels to be set for geographic maps.
fig = pygmt.Figure()
fig.basemap(
    region=[0, 10, 0, 20],
    projection="X10c/8c",
    # Plot axis, tick marks, and axis labels on the west/left and south/bottom axes
    # Plot axis and tick marks on the north/top and east/right axes
    frame=["WSne", "x+lx-axis", "y+ly-axis"],
)
fig.show()
Out:
<IPython.core.display.Image object>
Total running time of the script: ( 0 minutes 12.193 seconds)