pygmt.Figure.grdview
-
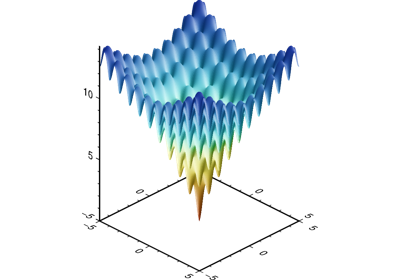
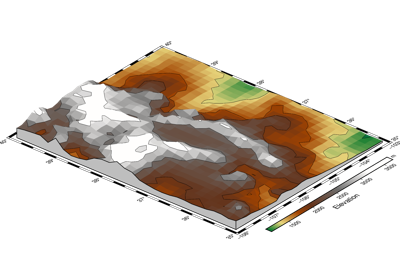
Figure.grdview(grid, **kwargs)¶ Create 3-D perspective image or surface mesh from a grid.
Reads a 2-D grid file and produces a 3-D perspective plot by drawing a mesh, painting a colored/gray-shaded surface made up of polygons, or by scanline conversion of these polygons to a raster image. Options include draping a data set on top of a surface, plotting of contours on top of the surface, and apply artificial illumination based on intensities provided in a separate grid file.
Full option list at https://docs.generic-mapping-tools.org/latest/grdview.html
Aliases:
B = frame
C = cmap
G = drapegrid
I = shading
J = projection
JZ = zsize
Jz = zscale
N = plane
Q = surftype
R = region
V = verbose
Wc = contourpen
Wf = facadepen
Wm = meshpen
X = xshift
Y = yshift
c = panel
f = coltypes
p = perspective
t = transparency
- Parameters
grid (str or xarray.DataArray) – The file name of the input relief grid or the grid loaded as a DataArray.
zscale/zsize (float or str) – Set z-axis scaling or z-axis size.
frame (bool or str or list) – Set map boundary frame and axes attributes.
cmap (str) – The name of the color palette table to use.
drapegrid (str or xarray.DataArray) – The file name or a DataArray of the image grid to be draped on top of the relief provided by grid. [Default determines colors from grid]. Note that
zscaleandplanealways refers to the grid. The drapegrid only provides the information pertaining to colors, which (if drapegrid is a grid) will be looked-up via the CPT (seecmap).plane (float or str) – level[+gfill]. Draws a plane at this z-level. If the optional color is provided via the +g modifier, and the projection is not oblique, the frontal facade between the plane and the data perimeter is colored.
surftype (str) –
Specifies cover type of the grid. Select one of following settings:
m - mesh plot [Default].
mx or my - waterfall plots (row or column profiles).
s - surface plot, and optionally append m to have mesh lines drawn on top of the surface.
i - image plot.
c - Same as i but will make nodes with z = NaN transparent.
For any of these choices, you may force a monochrome image by appending the modifier +m.
contourpen (str) – Draw contour lines on top of surface or mesh (not image). Append pen attributes used for the contours.
meshpen (str) – Sets the pen attributes used for the mesh. You must also select
surftypeof m or sm for meshlines to be drawn.facadepen (str) – Sets the pen attributes used for the facade. You must also select
planefor the facade outline to be drawn.shading (str) – Provide the name of a grid file with intensities in the (-1,+1) range, or a constant intensity to apply everywhere (affects the ambient light). Alternatively, derive an intensity grid from the input data grid reliefgrid via a call to
grdgradient; append +aazimuth, +nargs, and +mambient to specify azimuth, intensity, and ambient arguments for that module, or just give +d to select the default arguments [Default is +a-45+nt1+m0].Select verbosity level [Default is w], which modulates the messages written to stderr. Choose among 7 levels of verbosity:
q - Quiet, not even fatal error messages are produced
e - Error messages only
w - Warnings [Default]
t - Timings (report runtimes for time-intensive algorithms);
i - Informational messages (same as
verbose=True)c - Compatibility warnings
d - Debugging messages
xshift (str) – [a|c|f|r][xshift]. Shift plot origin in x-direction.
yshift (str) – [a|c|f|r][yshift]. Shift plot origin in y-direction. Full documentation is at https://docs.generic-mapping-tools.org/latest/gmt.html#xy-full.
panel (bool or int or list) – [row,col|index]. Selects a specific subplot panel. Only allowed when in subplot mode. Use
panel=Trueto advance to the next panel in the selected order. Instead of row,col you may also give a scalar value index which depends on the order you set viaautolabelwhen the subplot was defined. Note: row, col, and index all start at 0.coltypes (str) – [i|o]colinfo. Specify data types of input and/or output columns (time or geographical data). Full documentation is at https://docs.generic-mapping-tools.org/latest/gmt.html#f-full.
perspective (list or str) – [x|y|z]azim[/elev[/zlevel]][+wlon0/lat0[/z0]][+vx0/y0]. Select perspective view and set the azimuth and elevation angle of the viewpoint. Default is [180, 90]. Full documentation is at https://docs.generic-mapping-tools.org/latest/gmt.html#perspective-full.
transparency (int or float) – Set transparency level, in [0-100] percent range. Default is 0, i.e., opaque. Only visible when PDF or raster format output is selected. Only the PNG format selection adds a transparency layer in the image (for further processing).