Note
Click here to download the full example code
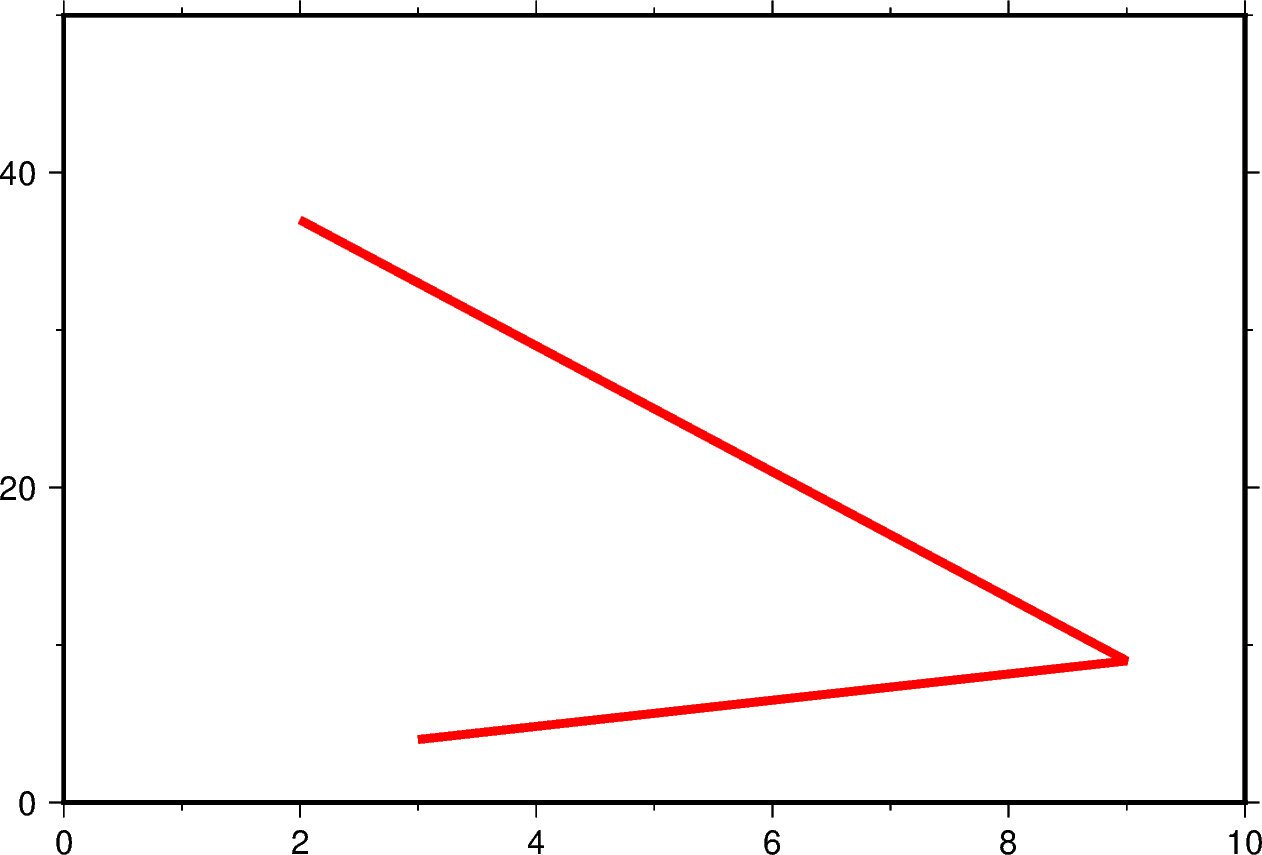
Cartesian linear
Xwidth/[height]: Give the width of the figure and the optional height.
Out:
<IPython.core.display.Image object>
import pygmt

fig = pygmt.Figure()
fig.plot(
    # The x and y parameters determine the coordinates of lines
    x=[3, 9, 2],
    y=[4, 9, 37],
    pen="3p,red",
    # ``region`` sets the x and y ranges or the Cartesian figure.
    region=[0, 10, 0, 50],
    projection="X15c/10c",
    # ``WSne`` is passed to ``frame`` to put axis labels only on the left and bottom axes.
    frame=["af", "WSne"],
)
fig.show()
Total running time of the script: ( 0 minutes 1.048 seconds)