Note
Click here to download the full example code
Polar
Pwidth: Give the width of the figure.
Out:
<IPython.core.display.Image object>
import pygmt
fig = pygmt.Figure()
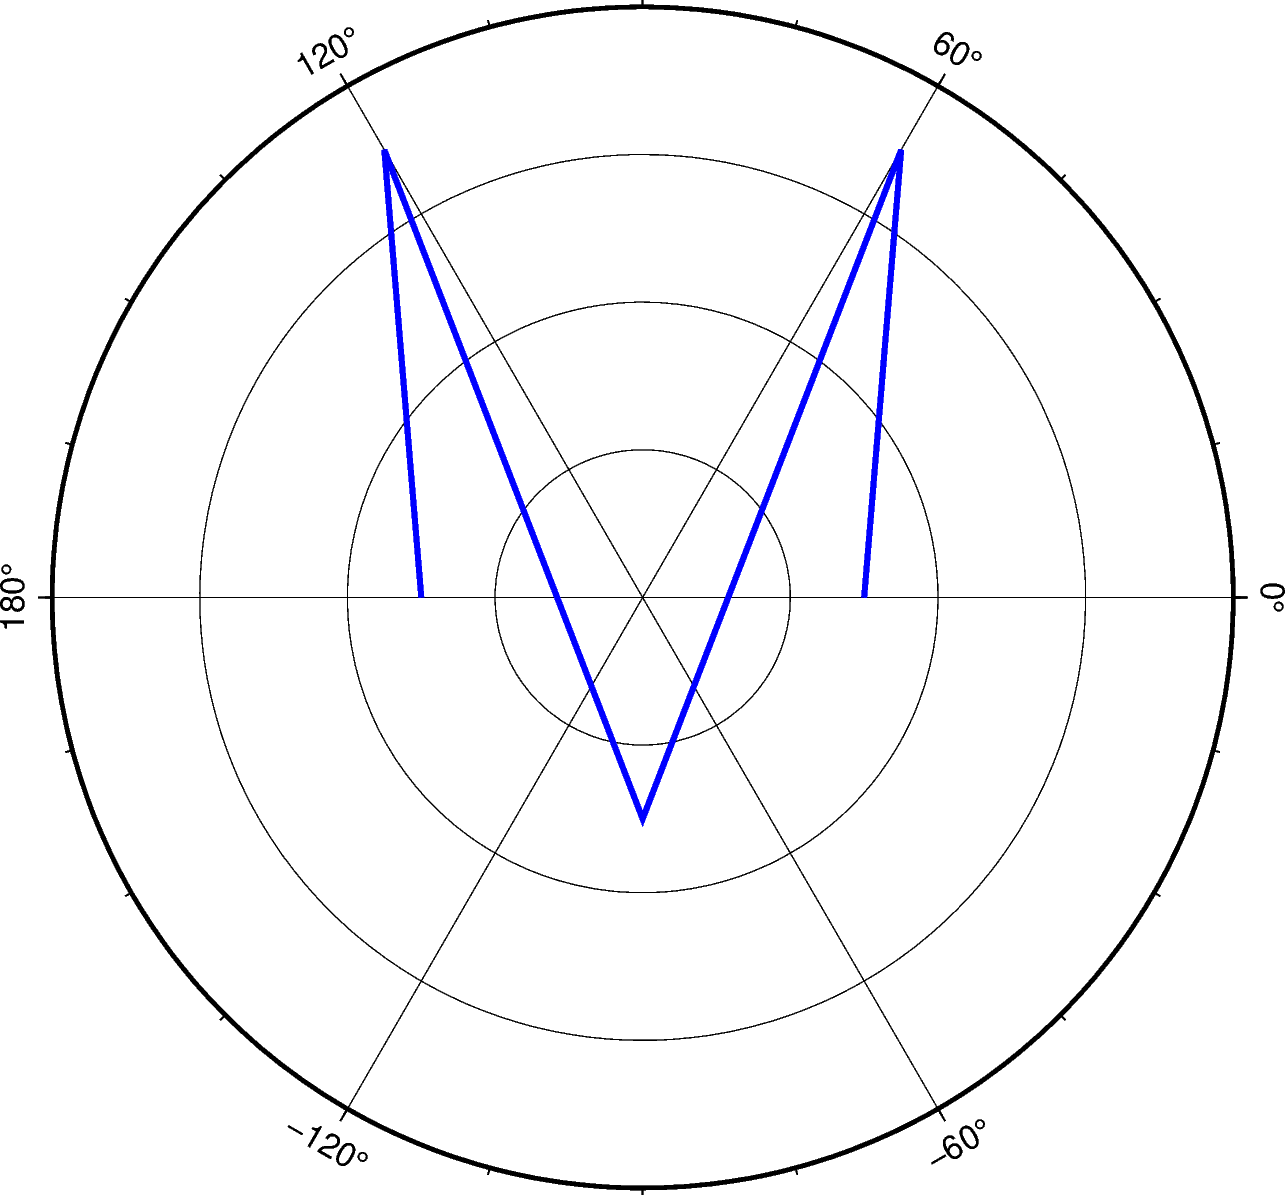
fig.plot(
# x inputs are the theta values for a polar plot.
x=[180, 120, 270, 60, 0],
# y inputs are the radius values for a polar plot.
y=[15, 35, 15, 35, 15],
pen="2p,blue",
# The region values are theta-min/theta-max/radius-min/radius-max.
region=[0, 360, 0, 40],
projection="P15c",
frame=["afg"],
)
fig.show()
Total running time of the script: ( 0 minutes 1.334 seconds)