Getting Started
User Guide
Reference documentation
Getting help and contributing
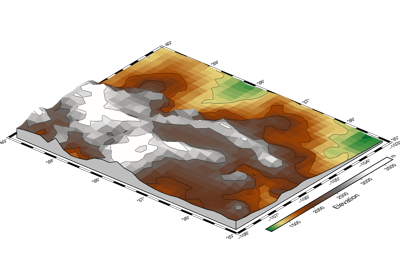
Creating a 3D perspective image
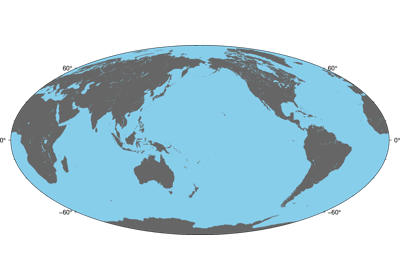
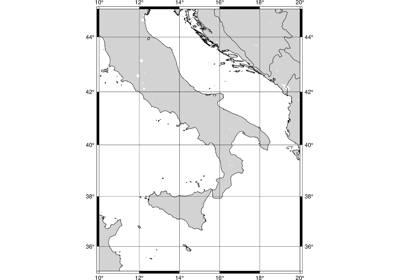
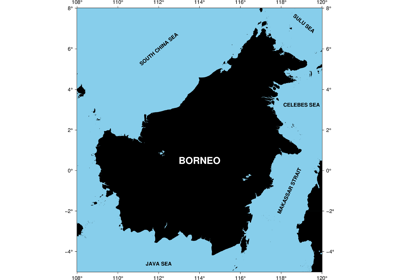
Coastlines and borders
Configuring PyGMT defaults
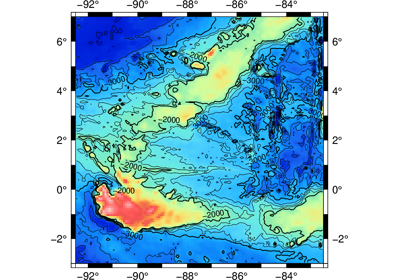
Creating a map with contour lines
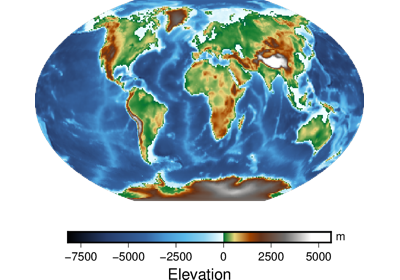
Plotting Earth relief
Making your first figure
Frames, ticks, titles, and labels
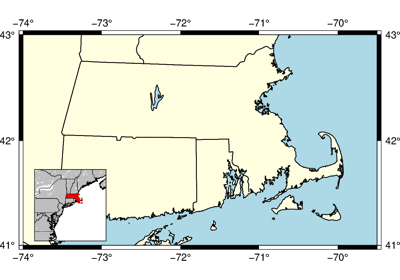
Adding an inset to the figure
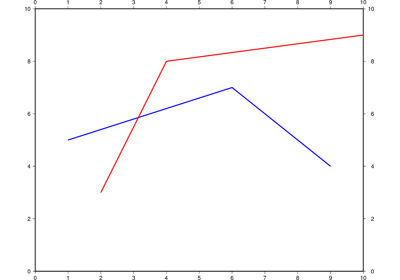
Plot lines
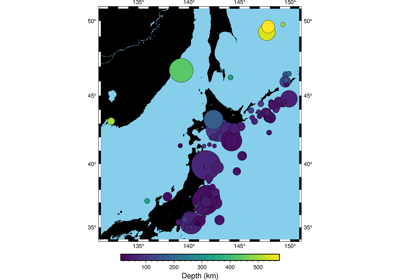
Plotting data points
Set the region
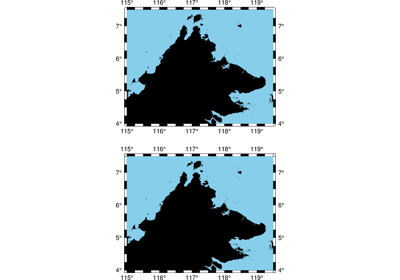
Making subplots
Plotting text
Gallery generated by Sphinx-Gallery