pygmt.Figure.meca
-
Figure.meca(spec, scale, longitude=None, latitude=None, depth=None, convention=None, component='full', plot_longitude=None, plot_latitude=None, **kwargs)¶ Plot focal mechanisms.
Full option list at https://docs.generic-mapping-tools.org/latest/supplements/seis/meca.html
Note
Currently, labeling of beachballs with text strings is only supported via providing a file to spec as input.
Aliases:
B = frame
C = offset
J = projection
N = no_clip
R = region
V = verbose
X = xshift
Y = yshift
c = panel
p = perspective
t = transparency
- Parameters
spec (dict, 1D array, 2D array, pd.DataFrame, or str) –
Either a filename containing focal mechanism parameters as columns, a 1- or 2-D array with the same, or a dictionary. If a filename or array, convention is required so we know how to interpret the columns/entries. If a dictionary, the following combinations of keys are supported; these determine the convention. Dictionary may contain values for a single focal mechanism or lists of values for many focal mechanisms. A Pandas DataFrame may optionally contain columns latitude, longitude, depth, plot_longitude, and/or plot_latitude instead of passing them to the meca method.
"aki"— strike, dip, rake, magnitude"gcmt"— strike1, dip1, rake1, strike2, dip2, rake2, mantissa, exponent"mt"— mrr, mtt, mff, mrt, mrf, mtf, exponent"partial"— strike1, dip1, strike2, fault_type, magnitude"principal_axis"— t_exponent, t_azimuth, t_plunge, n_exponent, n_azimuth, n_plunge, p_exponent, p_azimuth, p_plunge, exponent
scale (str) – Adjusts the scaling of the radius of the beachball, which is proportional to the magnitude. Scale defines the size for magnitude = 5 (i.e. scalar seismic moment M0 = 4.0E23 dynes-cm)
longitude (int, float, list, or 1d numpy array) – Longitude(s) of event location. Ignored if spec is not a dictionary. List must be the length of the number of events. Ignored if spec is a DataFrame and contains a ‘longitude’ column.
latitude (int, float, list, or 1d numpy array) – Latitude(s) of event location. Ignored if spec is not a dictionary. List must be the length of the number of events. Ignored if spec is a DataFrame and contains a ‘latitude’ column.
depth (int, float, list, or 1d numpy array) – Depth(s) of event location in kilometers. Ignored if spec is not a dictionary. List must be the length of the number of events. Ignored if spec is a DataFrame and contains a ‘depth’ column.
convention (str) –
"aki"(Aki & Richards),"gcmt"(global CMT),"mt"(seismic moment tensor),"partial"(partial focal mechanism), or"principal_axis"(principal axis). Ignored if spec is a dictionary or dataframe.component (str) – The component of the seismic moment tensor to plot.
"full"(the full seismic moment tensor),"dc"(the closest double couple with zero trace and zero determinant),"deviatoric"(zero trace)plot_longitude (int, float, list, or 1d numpy array) – Longitude(s) at which to place beachball, only used if spec is a dictionary. List must be the length of the number of events. Ignored if spec is a DataFrame and contains a ‘plot_longitude’ column.
plot_latitude (int, float, list, or 1d numpy array) – Latitude(s) at which to place beachball, only used if spec is a dictionary. List must be the length of the number of events. Ignored if spec is a DataFrame and contains a ‘plot_latitude’ column.
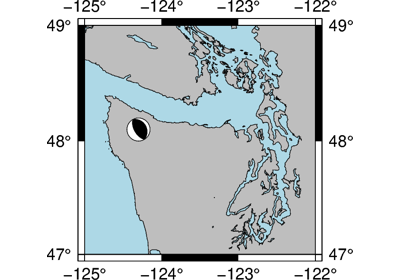
offset (bool or str) – Offsets beachballs to the longitude, latitude specified in the last two columns of the input file or array, or by plot_longitude and plot_latitude if provided. A small circle is plotted at the initial location and a line connects the beachball to the circle. Specify pen and optionally append
+ssizeto change the line style and/or size of the circle.no_clip (bool) – Does NOT skip symbols that fall outside frame boundary specified by region [Default is False, i.e. plot symbols inside map frame only].
projection (str) – Required if this is the first plot command. projcode[projparams/]width. Select map projection.
region (str or list) – Required if this is the first plot command. xmin/xmax/ymin/ymax[+r][+uunit]. Specify the region of interest.
frame (bool or str or list) – Set map boundary frame and axes attributes.
Select verbosity level [Default is w], which modulates the messages written to stderr. Choose among 7 levels of verbosity:
q - Quiet, not even fatal error messages are produced
e - Error messages only
w - Warnings [Default]
t - Timings (report runtimes for time-intensive algorthms);
i - Informational messages (same as
verbose=True)c - Compatibility warnings
d - Debugging messages
xshift (str) – [a|c|f|r][xshift]. Shift plot origin in x-direction.
yshift (str) – [a|c|f|r][yshift]. Shift plot origin in y-direction. Full documentation is at https://docs.generic-mapping-tools.org/latest/gmt.html#xy-full.
panel (bool or int or list) – [row,col|index]. Selects a specific subplot panel. Only allowed when in subplot mode. Use
panel=Trueto advance to the next panel in the selected order. Instead of row,col you may also give a scalar value index which depends on the order you set viaautolabelwhen the subplot was defined. Note: row, col, and index all start at 0.perspective (list or str) – [x|y|z]azim[/elev[/zlevel]][+wlon0/lat0[/z0]][+vx0/y0]. Select perspective view and set the azimuth and elevation angle of the viewpoint. Default is [180, 90]. Full documentation is at https://docs.generic-mapping-tools.org/latest/gmt.html#perspective-full.
transparency (int or float) – Set transparency level, in [0-100] percent range. Default is 0, i.e., opaque. Only visible when PDF or raster format output is selected. Only the PNG format selection adds a transparency layer in the image (for further processing).