pygmt.datasets.load_earth_relief
- pygmt.datasets.load_earth_relief(resolution='01d', region=None, registration=None, data_source='igpp', use_srtm=False)[source]
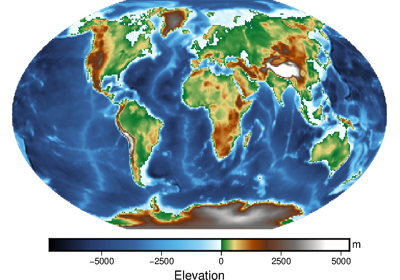
Load the Earth relief datasets (topography and bathymetry) in various resolutions.
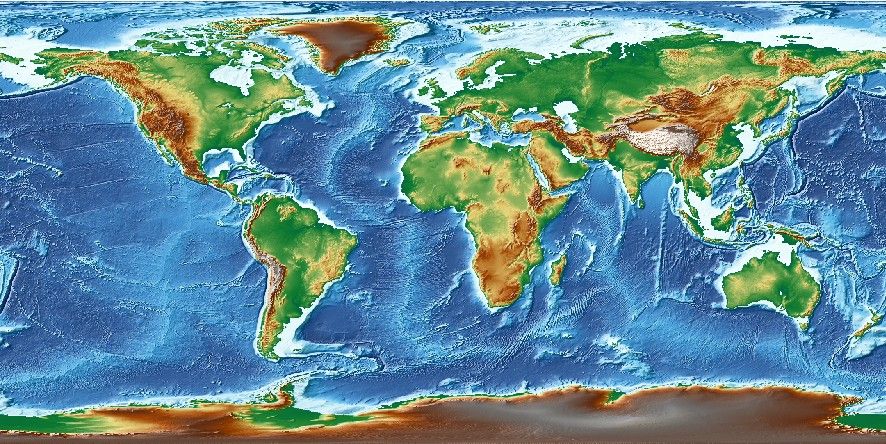
Earth relief datasets (topography and bathymetry).
This function downloads the dataset from the GMT data server, caches it in a user data directory (usually
~/.gmt/server/earth/earth_relief,~/.gmt/server/earth/earth_gebco,~/.gmt/server/earth/earth_gebcosi,~/.gmt/server/earth/earth_synbath), and load the dataset as anxarray.DataArray. An internet connection is required the first time around, but subsequent calls will load the dataset from the local data directory.The dataset can also be accessed by specifying a file name in any grid processing function or plotting method, using the following file name format: @earth_relief_type_res_reg. earth_relief_type is the GMT name for the dataset. The available options are earth_relief, earth_gebco, earth_gebcosi, and earth_synbath. res is the grid resolution; reg is the grid registration type (p for pixel registration, g for gridline registration). If reg is omitted (e.g.,
@earth_relief_01d), the gridline-registered grid will be loaded for grid processing functions and the pixel-registered grid willcbe loaded for plotting functions. If res is also omitted (i.e.,@earth_relief), GMT automatically selects a suitable resolution based on the current region and projection settings.This dataset comes with a color palette table (CPT) file,
gmt/geo. To use the dataset-specific CPT when plotting the dataset, explicitly setcmap="gmt/geo", otherwise GMT’s default CPT (google/turbo) will be used. If the dataset is referenced by the file name in a grid plotting method, the dataset-specific CPT file is used automatically unless another CPT is specified.Refer to https://www.generic-mapping-tools.org/remote-datasets/earth-relief.html for more details about available datasets, including version information and references.
- Parameters:
resolution (
Literal['01d','30m','20m','15m','10m','06m','05m','04m','03m','02m','01m','30s','15s','03s','01s'], default:'01d') – The grid resolution. The suffixd,mandsstand for arc-degrees, arc-minutes, and arc-seconds.region (
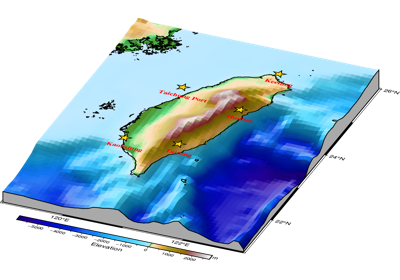
Sequence[float] |str|None, default:None) – The subregion of the grid to load, in the form of a sequence [xmin, xmax, ymin, ymax] or an ISO country code. Required for grids with resolutions higher than 5 arc-minutes (i.e.,"05m").registration (
Literal['gridline','pixel',None], default:None) – Grid registration type. Either"pixel"for pixel registration or"gridline"for gridline registration. Default isNone, which means"gridline"for all resolutions except"15s"which is"pixel"only.data_source (
Literal['igpp','gebco','gebcosi','synbath'], default:'igpp') –Select the source for the Earth relief data. Available options are:
"igpp": IGPP Earth Relief. See https://www.generic-mapping-tools.org/remote-datasets/earth-relief.html."synbath": IGPP Earth Relief dataset that uses statistical properties of young seafloor to provide a more realistic relief of young areas with small seamounts."gebco": GEBCO Earth Relief with only observed relief and inferred relief via altimetric gravity. See https://www.generic-mapping-tools.org/remote-datasets/earth-gebco.html."gebcosi": GEBCO Earth Relief that gives sub-ice (si) elevations.
Notes: Only the
"igpp"data source provides the highest resolutions"03s"and"01s".use_srtm (
bool, default:False) – For the resolutions"03s"and"01s", by default the land-only SRTM tiles from NASA are used along with up-sampled SRTM15 tiles (with a resolution of 15 arc-seconds) to fill in the missing ocean values. If set toTrue, only the original land-only SRTM tiles are loaded without filling in the ocean values. Only available fordata_source="igpp".
- Return type:
- Returns:
grid – The Earth relief grid. Coordinates are latitude and longitude in degrees. Relief is in meters.
Note
The registration and coordinate system type of the returned
xarray.DataArraygrid can be accessed via the gmt accessor. Refer topygmt.GMTDataArrayAccessorfor detailed explanations and limitations.Examples
>>> from pygmt.datasets import load_earth_relief
>>> # Load the default grid (gridline-registered 1 arc-degree grid)
>>> grid = load_earth_relief()
>>> # Load the 30 arc-minutes grid with "gridline" registration
>>> grid = load_earth_relief(resolution="30m", registration="gridline")
>>> # Load high-resolution (5 arc-minutes) grid for a specific region
>>> grid = load_earth_relief(
...     resolution="05m",
...     region=[120, 160, 30, 60],
...     registration="gridline",
... )
>>> # Load the original 3 arc-seconds land-only SRTM tiles from NASA
>>> grid = load_earth_relief(
...     resolution="03s",
...     region=[135, 136, 35, 36],
...     registration="gridline",
...     use_srtm=True,
... )
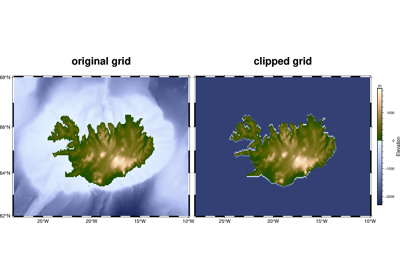
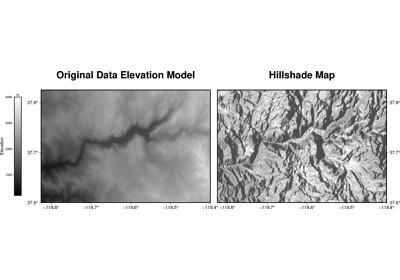
Examples using pygmt.datasets.load_earth_relief
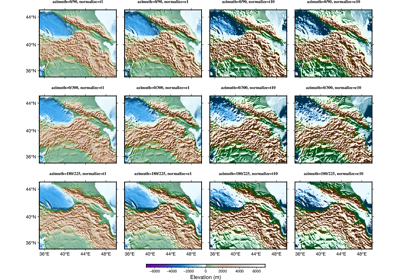
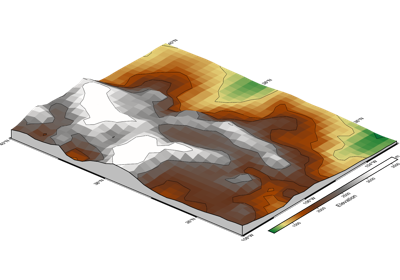
Calculating grid gradient with custom azimuth and normalization parameters