Note
Go to the end to download the full example code.
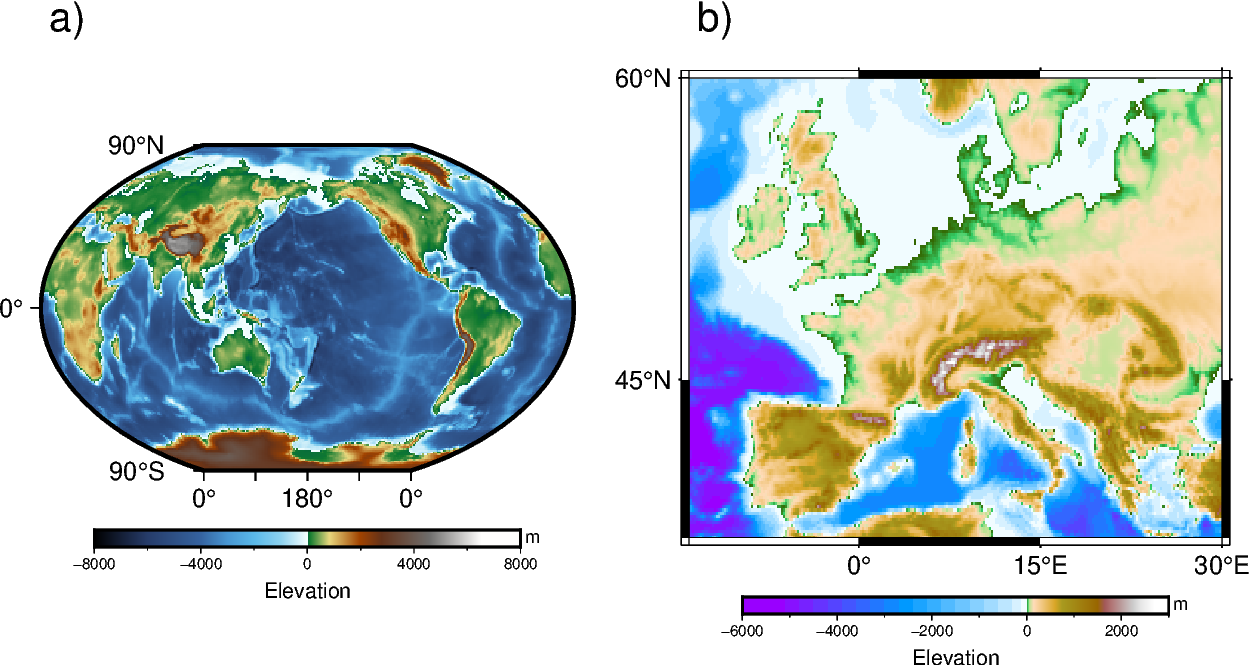
Multiple colormaps
This gallery example shows how to create multiple colormaps for different subplots. To better understand how GMT modern mode maintains several levels of colormaps, please refer to https://docs.generic-mapping-tools.org/6.6/reference/features.html#gmt-modern-mode-hierarchical-levels for details.
import pygmt
from pygmt.params import Axis

fig = pygmt.Figure()

# Load Earth relief data for the entire globe and a subset region
grid_globe = pygmt.datasets.load_earth_relief(resolution="01d")
subset_region = [-14, 30, 35, 60]
grid_subset = pygmt.datasets.load_earth_relief(resolution="10m", region=subset_region)

# Define a 1-row, 2-column subplot layout. The overall figure dimensions are set to be
# 15 cm wide and 8 cm high. Each subplot is automatically tagged. The space between the
# subplots is set to be 0.5 cm.
with fig.subplot(nrows=1, ncols=2, figsize=("15c", "8c"), tag=True, margins=0.5):
    # Activate the first panel so that the colormap created by the makecpt function is
    # a panel-level CPT
    with fig.set_panel(panel=0):
        pygmt.makecpt(cmap="gmt/geo", series=[-8000, 8000])
        # "R?" means Winkel Tripel projection with map width automatically determined
        # from the subplot width.
        fig.basemap(projection="R?", region="g", frame=Axis(annot=True))
        fig.grdimage(grid=grid_globe)
        fig.colorbar(annot=4000, tick=2000, label="Elevation", unit="m")
    # Activate the second panel so that the colormap created by the makecpt function is
    # a panel-level CPT
    with fig.set_panel(panel=1):
        pygmt.makecpt(cmap="gmt/globe", series=[-6000, 3000])
        # "M?" means Mercator projection with map width also automatically determined
        # from the subplot width.
        fig.basemap(projection="M?", region=subset_region, frame=Axis(annot=True))
        fig.grdimage(grid=grid_subset)
        fig.colorbar(annot=2000, tick=1000, label="Elevation", unit="m")

fig.show()
Total running time of the script: (0 minutes 0.320 seconds)