Note
Go to the end to download the full example code.
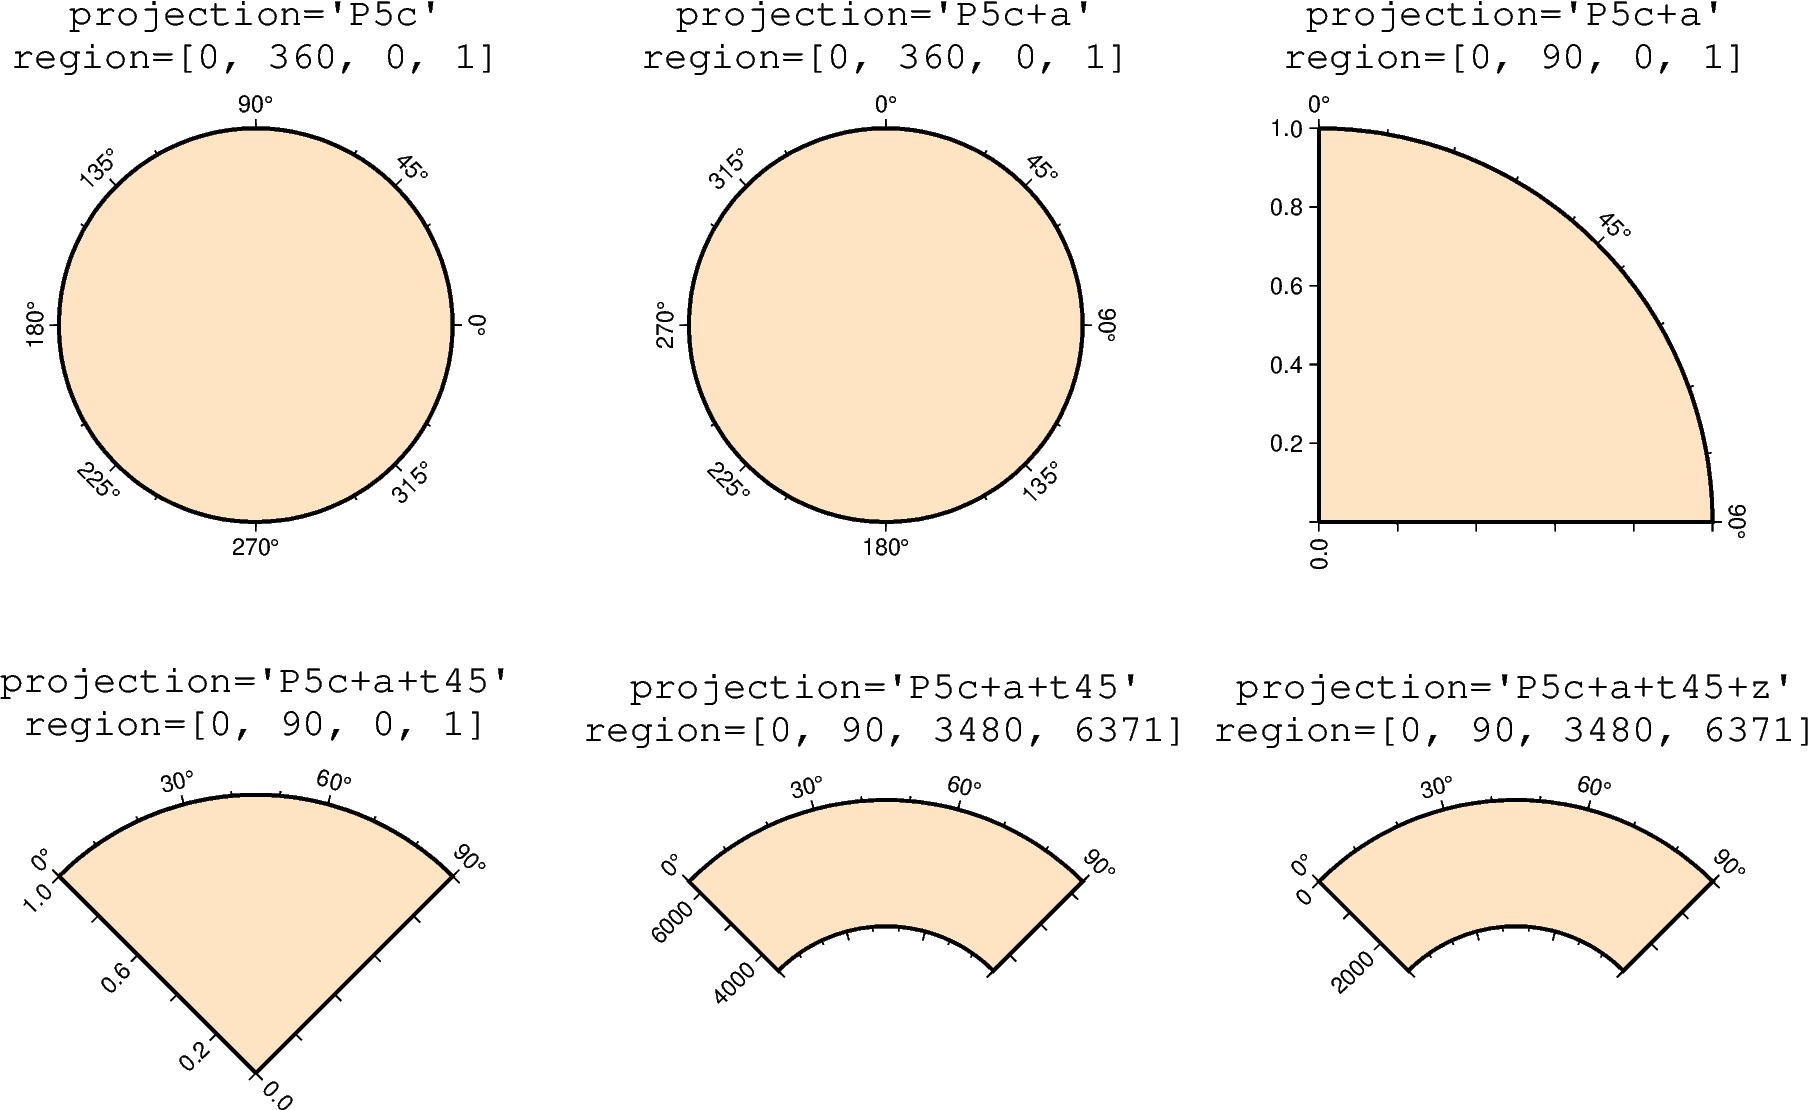
Polar
Polar projections allow plotting polar coordinate data (e.g. angle \(\theta\) and radius r).
The full syntax for polar projections is:
Pwidth[+a][+f[e|p|radius]][+roffset][+torigin][+z[p|radius]]
Limits are set via the region parameter
([theta_min, theta_max, radius_min, radius_max]). When using Pwidth you
have to give the width of the figure. The lowercase version p is similar to P
but expects a scale instead of a width (pscale).
The following customizing modifiers are available:
+a: by default, \(\theta\) refers to the angle that is equivalent to a counterclockwise rotation with respect to the east direction (standard definition); +a indicates that the input data are rotated clockwise relative to the north direction (geographical azimuth angle).
+roffset: represents the offset of the r-axis. This modifier allows you to offset the center of the circle from r=0.
+torigin: sets the angle corresponding to the east direction which is equivalent to rotating the entire coordinate axis clockwise; if the +a modifier is used, setting the angle corresponding to the north direction is equivalent to rotating the entire coordinate axis counterclockwise.
+f: reverses the radial direction.
Append e to indicate that the r-axis is an elevation angle, and the range of the r-axis should be between 0° and 90°.
Appending p sets the current Earth’s radius (determined by PROJ_ELLIPSOID) to the maximum value of the r-axis when the r-axis is reversed.
Append radius to set the maximum value of the r-axis.
+z: indicates that the r-axis is marked as depth instead of radius (e.g., r = radius - z).
Append p to set radius to the current Earth’s radius.
Append radius to set the value of the radius.
import pygmt
from pygmt.params import Axis, Frame

fig = pygmt.Figure()

pygmt.config(FONT_TITLE="14p,Courier,black", FORMAT_GEO_MAP="+D")

# ============
# Top left
fig.basemap(
    # Set plot limits to theta_min = 0, theta_max = 360, radius_min = 0, radius_max = 1
    region=[0, 360, 0, 1],
    # Set plot width to 5 cm
    projection="P5c",
    # Set the frame and title; @^ allows for a line break within the title
    frame=Frame(
        fill="bisque",
        title="projection='P5c' @^ region=[0, 360, 0, 1]",
        xaxis=Axis(annot=45, tick=True),
    ),
)

fig.shift_origin(xshift="w+3c")

# ============
# Top middle
fig.basemap(
    # Set plot limits to theta_min = 0, theta_max = 360, radius_min = 0, radius_max = 1
    region=[0, 360, 0, 1],
    # Set plot width to 5 cm and interpret input data as geographic azimuth instead of
    # standard angle
    projection="P5c+a",
    # Set the frame and title; @^ allows for a line break within the title
    frame=Frame(
        fill="bisque",
        title="projection='P5c+a' @^ region=[0, 360, 0, 1]",
        xaxis=Axis(annot=45, tick=True),
    ),
)

fig.shift_origin(xshift="w+3c")

# ============
# Top right
fig.basemap(
    # Set plot limits to theta_min = 0, theta_max = 90, radius_min = 0, radius_max = 1
    region=[0, 90, 0, 1],
    # Set plot width to 5 cm and interpret input data as geographic azimuth instead of
    # standard angle
    projection="P5c+a",
    # Set the frame and title; @^ allows for a line break within the title
    frame=Frame(
        axes="WNe",
        fill="bisque",
        title="projection='P5c+a' @^ region=[0, 90, 0, 1]",
        xaxis=Axis(annot=45, tick=True),
        yaxis=Axis(annot=0.2),
    ),
)

fig.shift_origin(xshift="-2w-6c", yshift="-h-2c")

# ============
# Bottom left
fig.basemap(
    # Set plot limits to theta_min = 0, theta_max = 90, radius_min = 0, radius_max = 1
    region=[0, 90, 0, 1],
    # Set plot width to 5 cm and interpret input data as geographic azimuth instead of
    # standard angle, rotate coordinate system counterclockwise by 45 degrees
    projection="P5c+a+t45",
    # Set the frame and title; @^ allows for a line break within the title
    frame=Frame(
        axes="WNe",
        fill="bisque",
        title="projection='P5c+a+t45' @^ region=[0, 90, 0, 1]",
        xaxis=Axis(annot=30, tick=True),
        yaxis=Axis(annot=0.2),
    ),
)

fig.shift_origin(xshift="w+3c", yshift="1.3c")

# ============
# Bottom middle
fig.basemap(
    # Set plot limits to theta_min = 0, theta_max = 90, radius_min = 3480,
    # radius_max = 6371 (Earth's radius)
    region=[0, 90, 3480, 6371],
    # Set plot width to 5 cm and interpret input data as geographic azimuth instead of
    # standard angle, rotate coordinate system counterclockwise by 45 degrees
    projection="P5c+a+t45",
    # Set the frame, and title; @^ allows for a line break within the title
    frame=Frame(
        axes="WNse",
        fill="bisque",
        title="projection='P5c+a+t45' @^ region=[0, 90, 3480, 6371]",
        xaxis=Axis(annot=30, tick=True),
        yaxis=Axis(annot=True),
    ),
)

fig.shift_origin(xshift="w+3c")

# ============
# Bottom right
fig.basemap(
    # Set plot limits to theta_min = 0, theta_max = 90, radius_min = 3480,
    # radius_max = 6371 (Earth's radius)
    region=[0, 90, 3480, 6371],
    # Set plot width to 5 cm and interpret input data as geographic azimuth instead of
    # standard angle, rotate coordinate system counterclockwise by 45 degrees, r-axis
    # is marked as depth
    projection="P5c+a+t45+z",
    # Set the frame, and title; @^ allows for a line break within the title
    frame=Frame(
        axes="WNse",
        fill="bisque",
        title="projection='P5c+a+t45+\\z' @^ region=[0, 90, 3480, 6371]",
        xaxis=Axis(annot=30, tick=True),
        yaxis=Axis(annot=True),
    ),
)

fig.show()
Total running time of the script: (0 minutes 0.283 seconds)