pygmt.Figure.show
- Figure.show(method=None, dpi=300, width=500, waiting=0.5, **kwargs)[source]
Display a preview of the figure.
Inserts the preview in the Jupyter notebook output if available, otherwise opens it in the default viewer for your operating system (falls back to the default web browser).
Use
pygmt.set_displayto select the default display method ("notebook","external","none"orNone).The
methodparameter allows to override the default display method for the current figure. The parametersdpiandwidthcan be used to control the resolution and dimension of the figure in the notebook.The external viewer can be disabled by setting the environment variable PYGMT_USE_EXTERNAL_DISPLAY to
"false". This is useful when running tests and building the documentation to avoid popping up windows.The external viewer does not block the current process, thus it’s necessary to suspend the execution of the current process for a short while after launching the external viewer, so that the preview image won’t be deleted before the external viewer tries to open it. Set the
waitingparameter to a larger number if the image viewer on your computer is slow to open the figure.- Parameters:
method (
Literal['external','notebook','none',None], default:None) –The method to display the current image preview. Choose from:
"external": External PDF preview using the default PDF viewer"notebook": Inline PNG preview in the current notebook"none": Disable image previewNone: Reset to the default display method
The default display method is
"external"in Python consoles and"notebook"in Jupyter notebooks, but can be changed bypygmt.set_display.dpi (
int, default:300) – The image resolution (dots per inch) in Jupyter notebooks.width (
int, default:500) – The image width (in pixels) in Jupyter notebooks.waiting (
float, default:0.5) – Suspend the execution of the current process for a given number of seconds after launching an external viewer. Only works ifmethod="external".**kwargs (dict) – Additional keyword arguments passed to
pygmt.Figure.psconvert. Valid parameters aregs_path,gs_option,resize,bb_style, andverbose.
- Return type:
Examples using pygmt.Figure.show


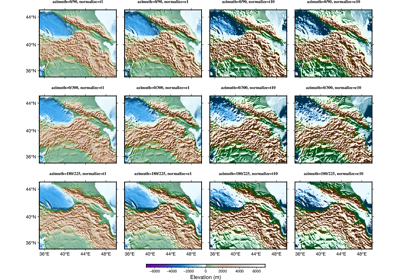
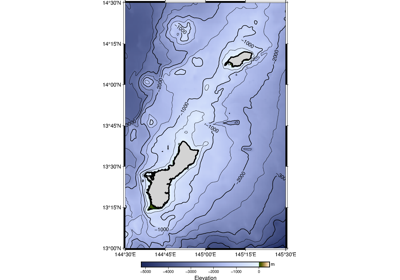
Calculating grid gradient with custom azimuth and normalization parameters

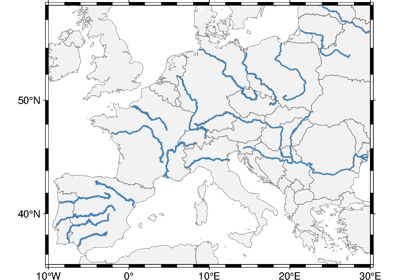
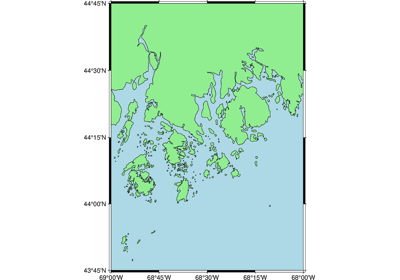
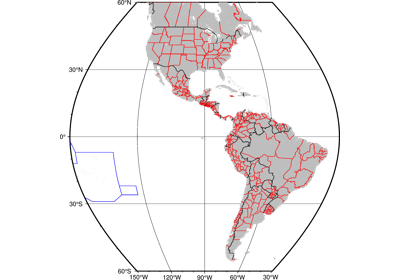
GeoPandas: Plotting lines with LineString or MultiLineString geometry


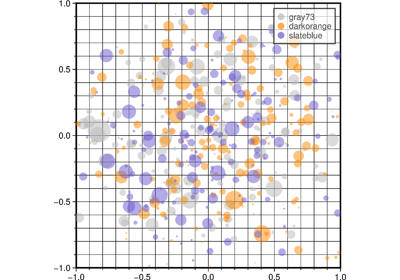
GeoPandas: Plotting points with Point or MultiPoint geometry