Note
Go to the end to download the full example code.
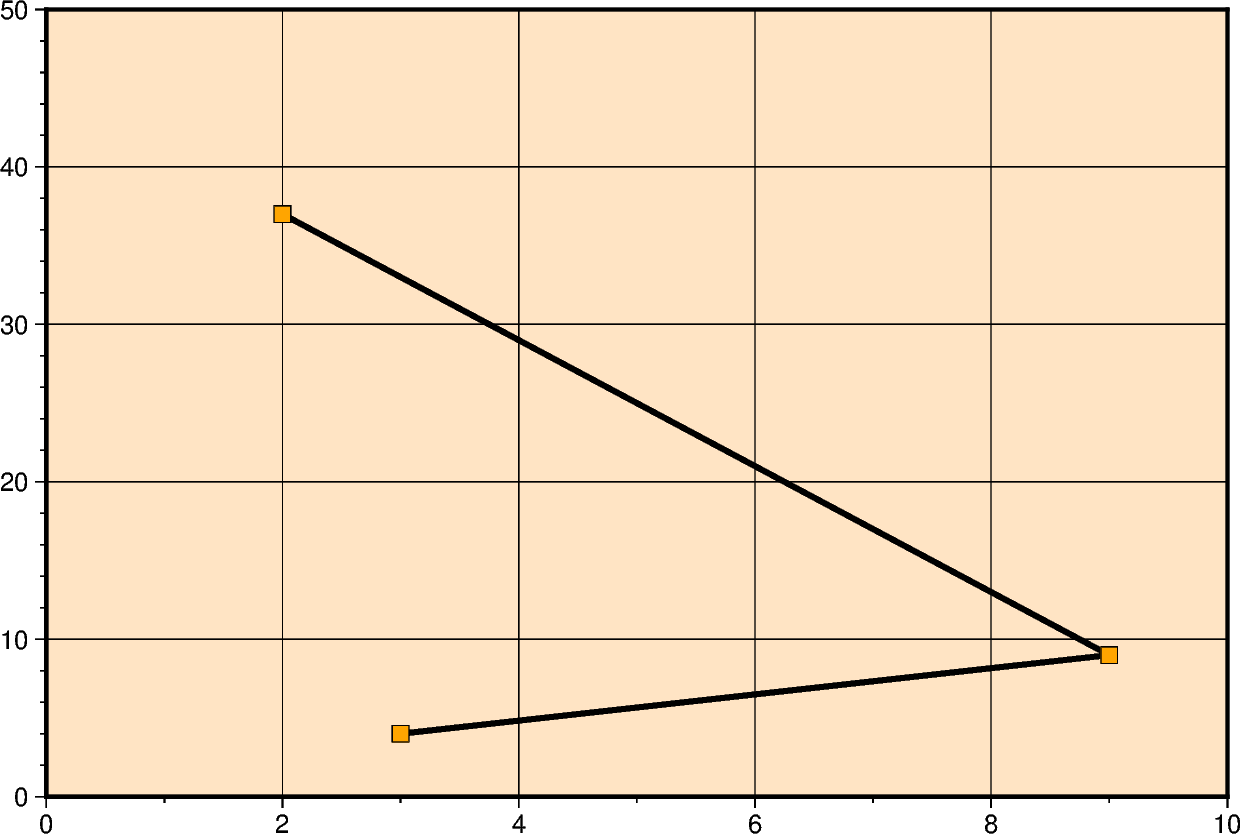
Cartesian linear
Xwidth[/height] or xx-scale[/y-scale]
Give the width of the figure and the optional height. The lowercase version x is similar to X but expects an x-scale and an optional y-scale.
The Cartesian linear projection is primarily designed for regular floating point data. To plot geographical data in a linear projection, see the upstream GMT documentation Geographic coordinates. To make the linear plot using calendar date/time as input coordinates, see the tutorial Plotting datetime charts. GMT documentation Calendar time coordinates.
import pygmt
from pygmt.params import Axis, Frame

fig = pygmt.Figure()
# The region parameter is specified as xmin, xmax, ymin, ymax
fig.basemap(
    region=[0, 10, 0, 50],
    projection="X15c/10c",
    frame=Frame(fill="bisque", axis=Axis(annot=True, tick=True, grid=True)),
)
fig.plot(x=[3, 9, 2], y=[4, 9, 37], pen="2p,black")
# Plot data points on top of the line
# Use squares with a size of 0.3 centimeters, an "orange" fill and a "black" outline
fig.plot(x=[3, 9, 2], y=[4, 9, 37], style="s0.3c", fill="orange", pen="black")
fig.show()
Total running time of the script: (0 minutes 0.146 seconds)