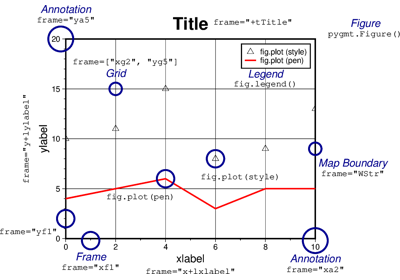
pygmt.Figure
- class pygmt.Figure[source]
A GMT figure to handle all plotting.
Use the plotting methods of this class to add elements to the figure. You can preview the figure using
pygmt.Figure.showand save the figure to a file usingpygmt.Figure.savefig.Examples
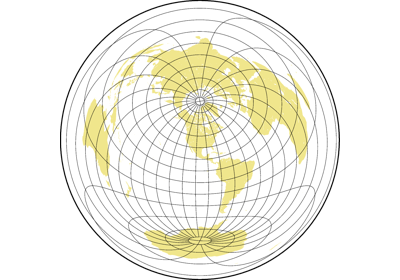
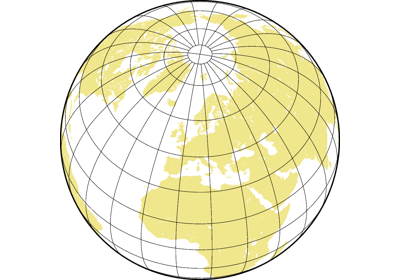
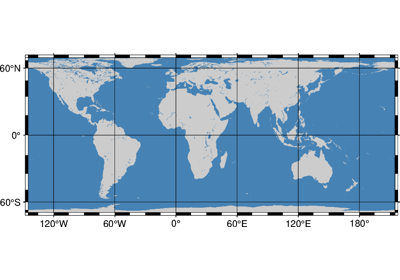
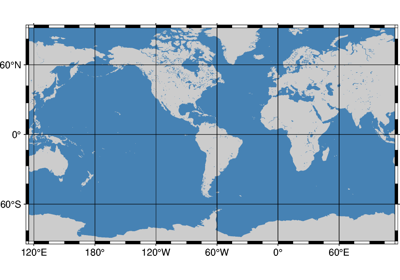
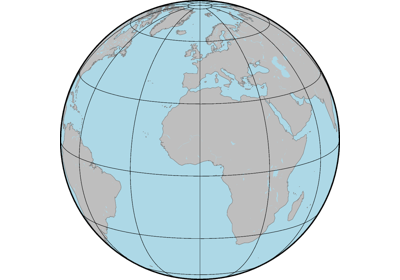
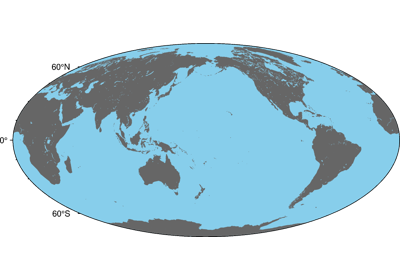
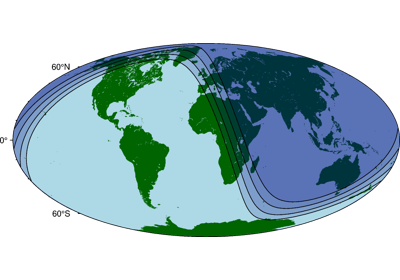
>>> import pygmt
>>> fig = pygmt.Figure()
>>> fig.basemap(region=[0, 360, -90, 90], projection="W15c", frame=True)
>>> fig.savefig("my-figure.png")
>>> # Make sure the figure file is generated and clean it up
>>> from pathlib import Path
>>> assert Path("my-figure.png").exists()
>>> Path("my-figure.png").unlink()
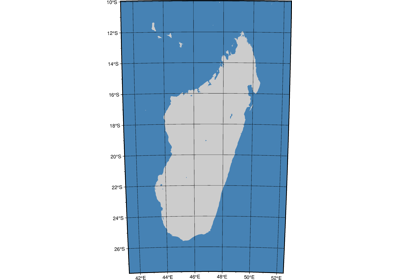
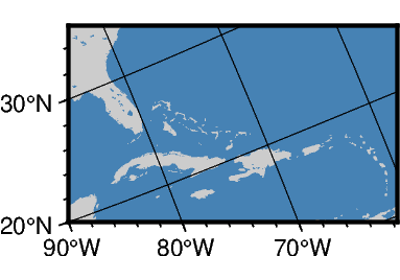
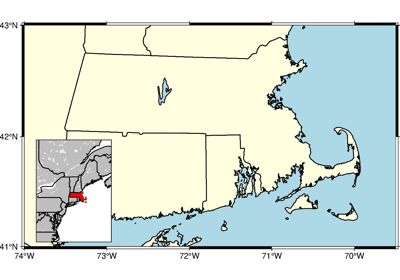
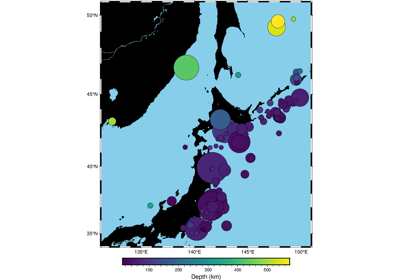
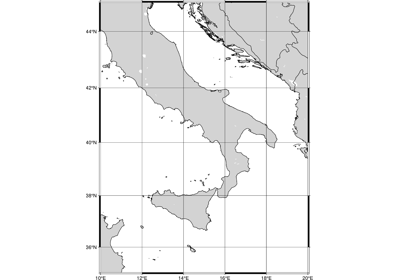
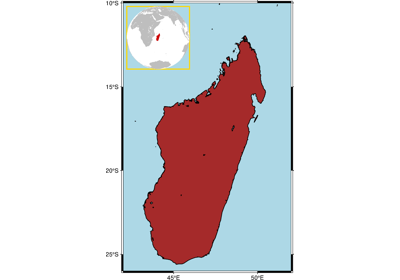
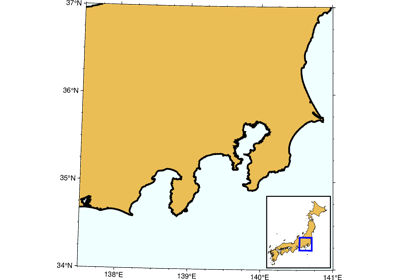
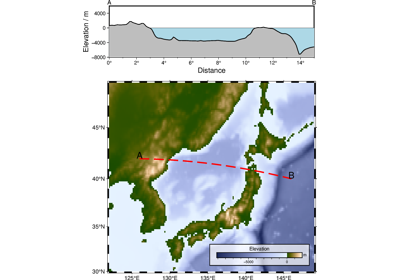
The plot region can be specified through ISO country codes (for example,
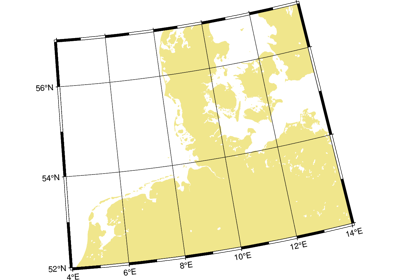
"JP"for Japan):>>> import pygmt >>> fig = pygmt.Figure() >>> fig.basemap(region="JP", projection="M7c", frame=True) >>> # The fig.region attribute shows the WESN bounding box for the figure >>> print(", ".join(f"{i:.2f}" for i in fig.region)) 122.94, 145.82, 20.53, 45.52
Attributes
- Figure.region
The geographic WESN bounding box for the current figure.
Methods Summary
|
Plot base maps and frames. |
|
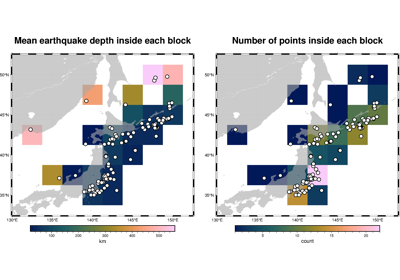
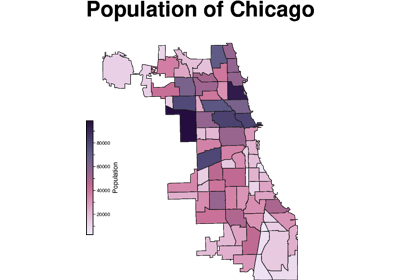
Plot a choropleth map. |
|
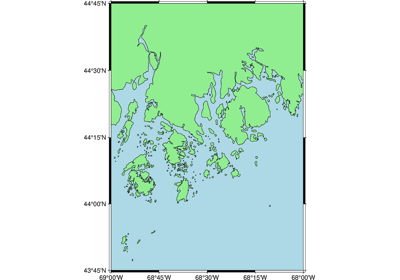
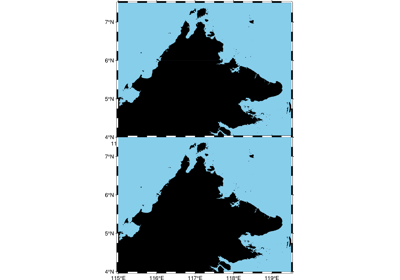
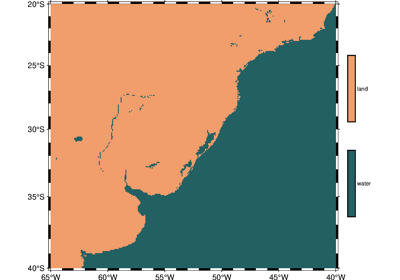
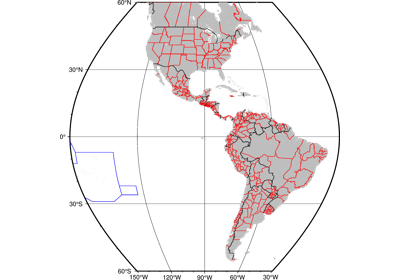
Plot continents, countries, shorelines, rivers, and borders. |
|
Plot gray scale or color scale bar. |
|
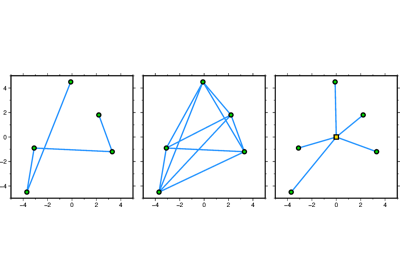
Contour table data by direct triangulation. |
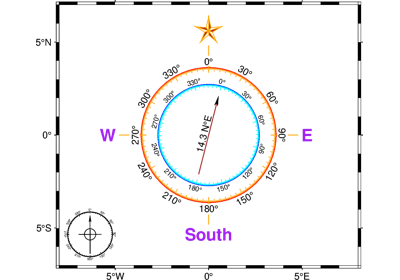
|
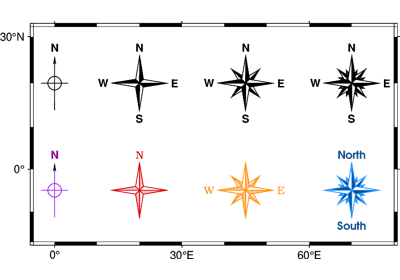
Add a directional rose on the map. |
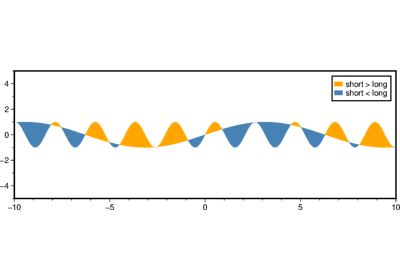
|
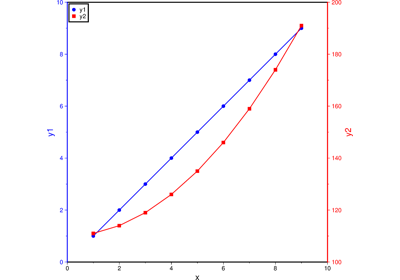
Fill the area between two horizontal curves. |
|
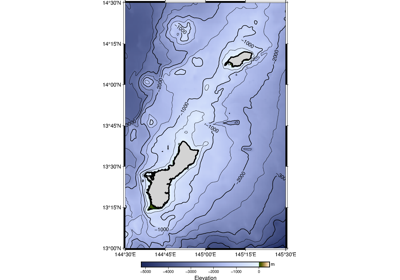
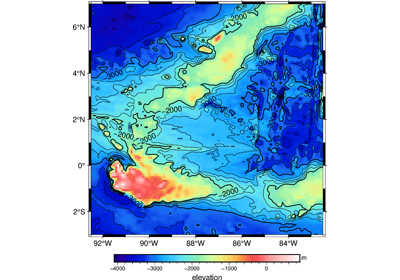
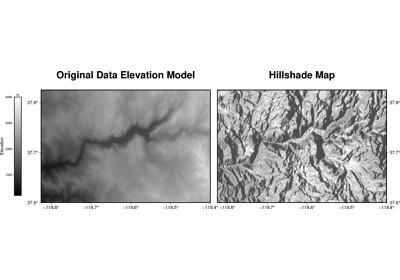
Make contour map using a grid. |
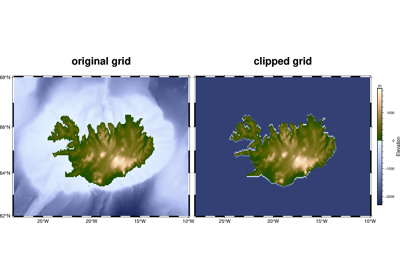
|
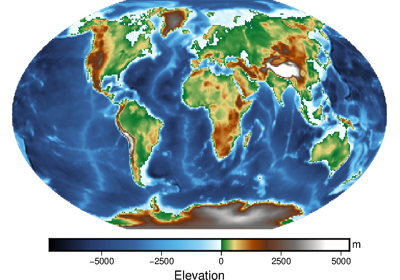
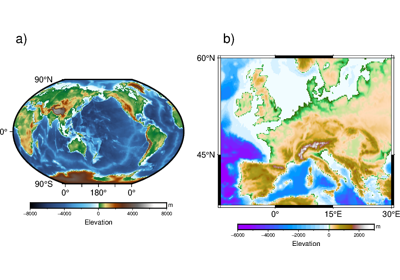
Project and plot grids or images. |
|
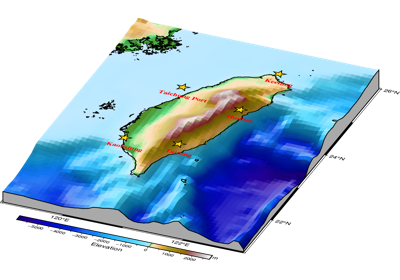
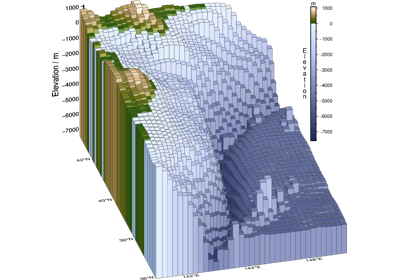
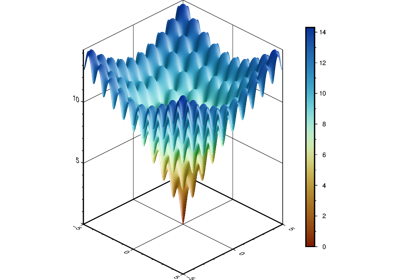
Create 3-D perspective image or surface mesh from a grid. |
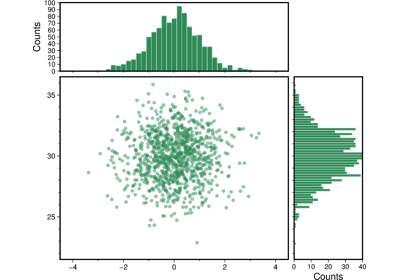
|
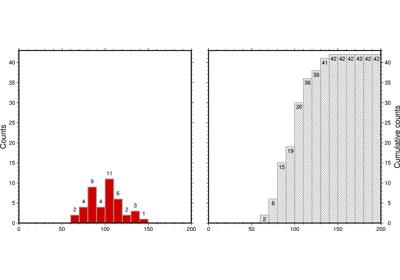
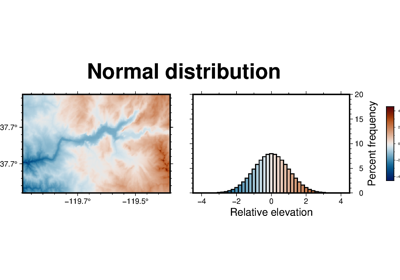
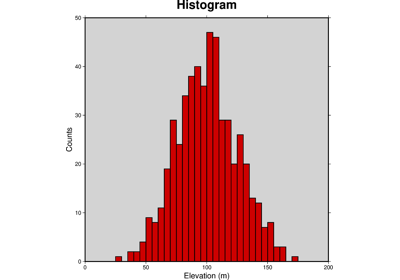
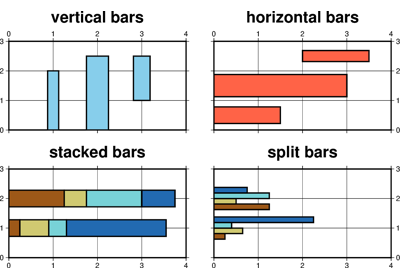
Calculate and plot histograms. |
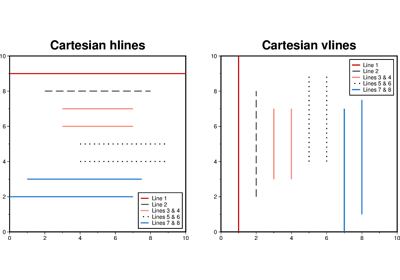
|
Plot one or multiple horizontal line(s). |
|
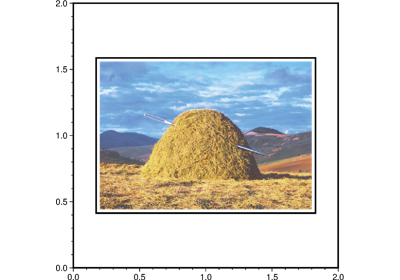
Plot raster or EPS images. |
|
Manage figure inset setup and completion. |
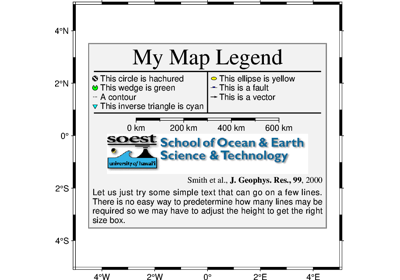
|
Plot a legend. |
|
Plot the GMT logo. |
|
Add a magnetic rose to the map. |
|
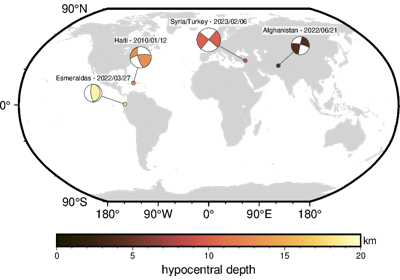
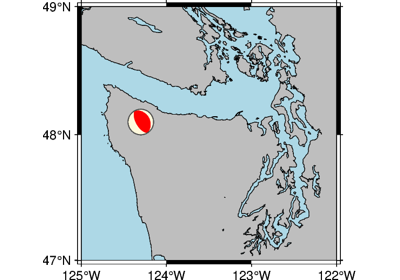
Plot focal mechanisms. |
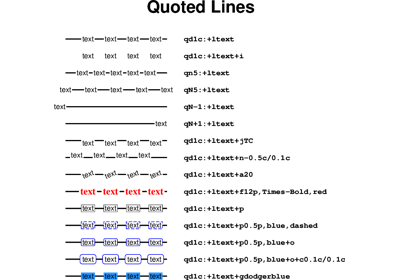
|
Typeset one or multiple paragraphs. |
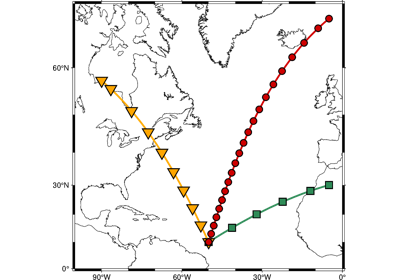
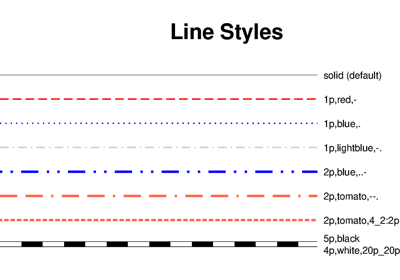
|
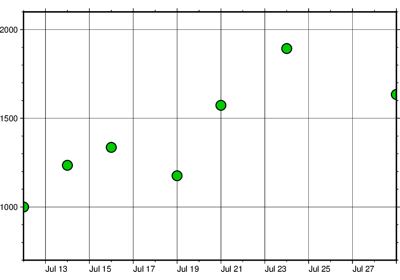
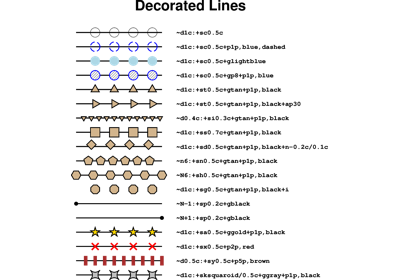
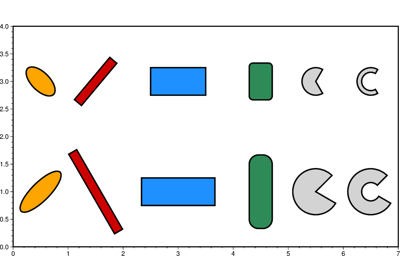
Plot lines, polygons, and symbols in 2-D. |
|
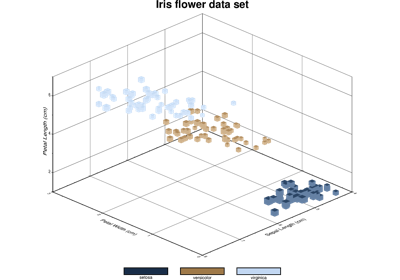
Plot lines, polygons, and symbols in 3-D. |
|
Convert [E]PS file(s) to other formats using Ghostscript. |
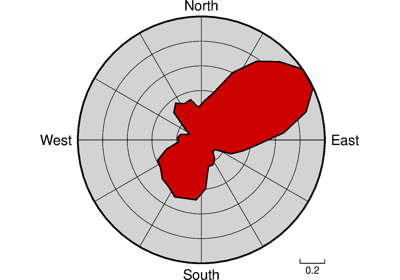
|
Plot a polar histogram (rose, sector, windrose diagrams). |
|
Save the figure to an image file. |
|
Add a scale bar on the plot. |
|
Set the current subplot panel to plot on. |
|
Shift the plot origin in x- and/or y-directions. |
|
Display a preview of the figure. |
|
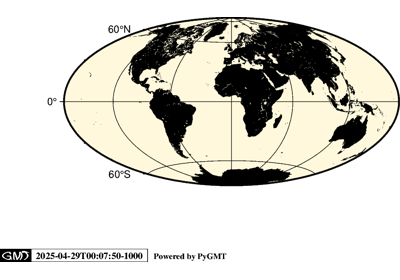
Plot day-night terminators and other sunlight parameters. |
|
Manage figure subplot configuration and selection. |
|
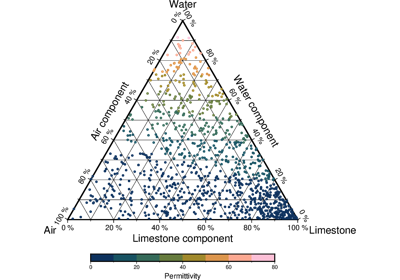
Plot data on ternary diagrams. |
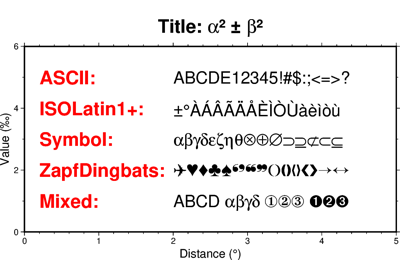
|
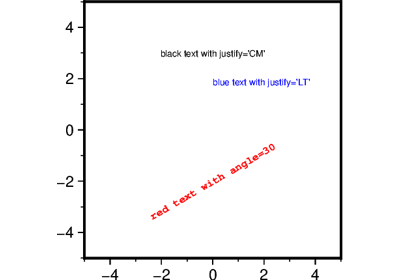
Plot or typeset text. |
|
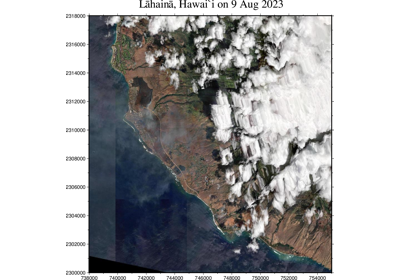
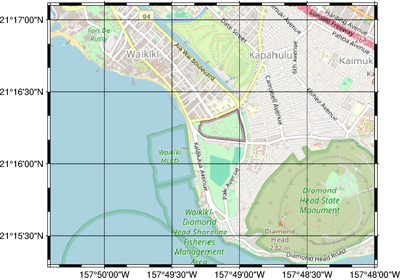
Plot an XYZ tile map. |
|
Plot the GMT timestamp logo. |
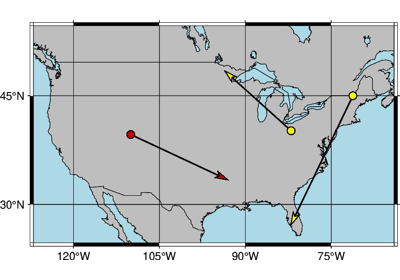
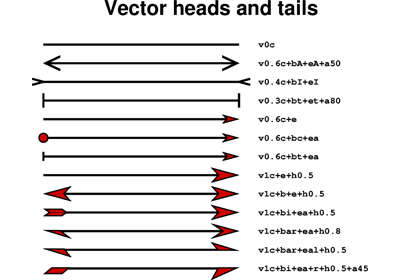
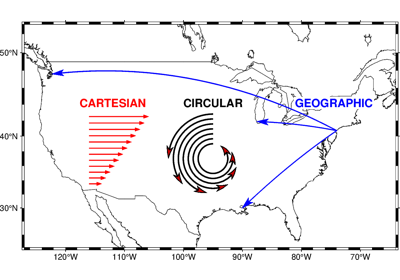
|
Plot velocity vectors, strain crosses, anisotropy bars, and wedges. |
|
Plot one or multiple vertical line(s). |
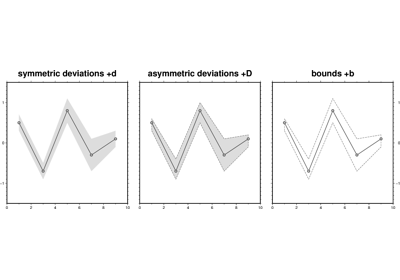
|
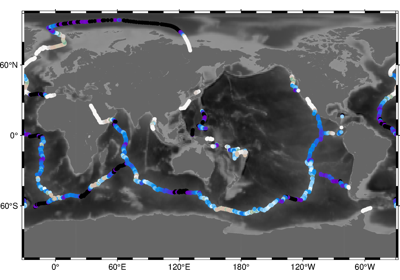
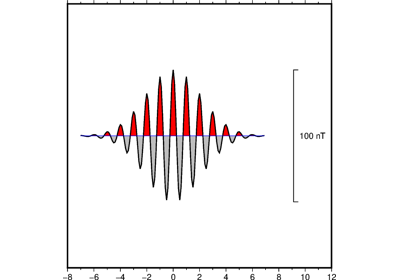
Plot z=f(x,y) anomalies along tracks. |
Examples using pygmt.Figure


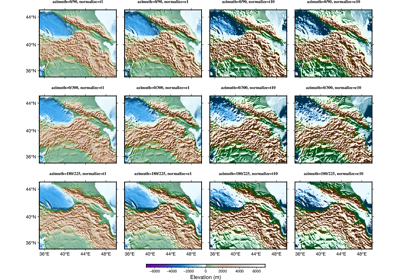
Calculating grid gradient with custom azimuth and normalization parameters
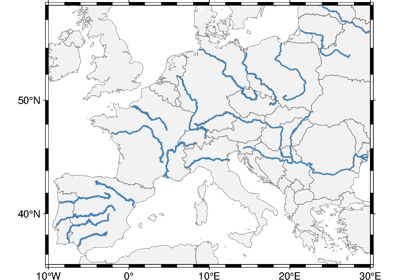
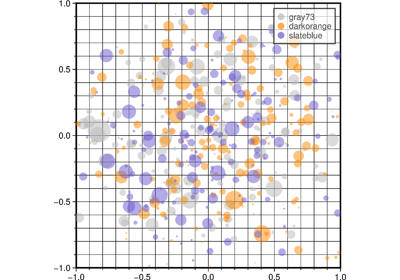
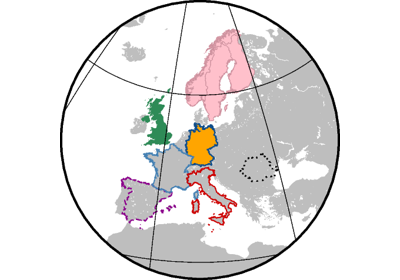
GeoPandas: Plotting lines with LineString or MultiLineString geometry


GeoPandas: Plotting points with Point or MultiPoint geometry