pygmt.Figure.meca
- Figure.meca(spec, scale, convention=None, component='full', longitude=None, latitude=None, depth=None, plot_longitude=None, plot_latitude=None, event_name=None, no_clip=False, projection=None, frame=False, region=None, verbose=False, panel=False, transparency=None, perspective=False, **kwargs)
Plot focal mechanisms.
The following focal mechanism conventions are supported:
Supported focal mechanism conventions. Convention
Description
Focal parameters
Remark
"aki"Aki and Richard
strike, dip, rake, magnitude
angles in degrees
"gcmt"global centroid moment tensor
strike1, dip1, rake1,strike2, dip2, rake2,mantissa, exponentangles in degrees;seismic moment is\(mantissa * 10 ^ {exponent}\)in dyn cm"mt"seismic moment tensor
mrr, mtt, mff,mrt, mrf, mtf,exponentmoment componentsin \(10 ^ {exponent}\) dyn cm"partial"partial focal mechanism
strike1, dip1, strike2,fault_type, magnitudeangles in degrees;fault_type means +1/-1 fornormal/reverse fault"principal_axis"principal axis
t_value, t_azimuth, t_plunge,n_value, n_azimuth, n_plunge,p_value, p_azimuth, p_plunge,exponentvalues in \(10 ^ {exponent}\) dyn cm;azimuths and plunges in degreesFull GMT docs at https://docs.generic-mapping-tools.org/6.6/supplements/seis/meca.html.
Aliases:
A = offset
C = cmap
E = extension_fill
Fr = label_box
G = compression_fill
L = outline
T = nodal
W = pen
B = frame
J = projection
N = no_clip
R = region
S = scale/convention/component
V = verbose
c = panel
p = perspective
t = transparency
- Parameters:
spec (str, 1-D numpy array, 2-D numpy array, dict, or pandas.DataFrame) –
Data that contain focal mechanism parameters.
speccan be specified in either of the following types:str: a file name containing focal mechanism parameters as columns. The meaning of each column is:
Columns 1 and 2: event longitude and latitude
Column 3: event depth (in kilometers)
Columns 4 to 3+n: focal mechanism parameters. The number of columns n depends on the choice of
convention(see the table above for the supported conventions).Columns 4+n and 5+n: longitude and latitude at which to place the beachball.
0 0plots the beachball at the longitude and latitude given in the columns 1 and 2. [optional; requiresoffset=True].Last Column: text string to appear near the beachball [optional].
1-D np.array: focal mechanism parameters of a single event. The meanings of columns are the same as above.
2-D np.array: focal mechanism parameters of multiple events. The meanings of columns are the same as above.
dict or
pandas.DataFrame: The dict keys orpandas.DataFramecolumn names determine the focal mechanism convention. For the different conventions, the combination of keys / column names as given in the table above are required.A dict may contain values for a single focal mechanism or lists of values for multiple focal mechanisms.
Both dict and
pandas.DataFramemay optionally contain the keys / column names:latitude,longitude,depth,plot_longitude,plot_latitude, and/orevent_name.
If
specis either a str or a 1-D or 2-D numpy array, theconventionparameter is required to interpret the columns. Ifspecis a dict or apandas.DataFrame,conventionis not needed and ignored if specified.scale (float or str) – scale[+aangle][+ffont][+jjustify][+l][+m][+odx[/dy]][+sreference]. Adjust scaling of the radius of the beachball, which is proportional to the magnitude. By default, scale defines the size for magnitude = 5 (i.e., scalar seismic moment M0 = 4.0E23 dyn cm). If +l is used the radius will be proportional to the seismic moment instead. Use +s and give a reference to change the reference magnitude (or moment), and use +m to plot all beachballs with the same size. A text string can be specified to appear near the beachball (corresponding to column or parameter
event_name). Append +aangle to change the angle of the text string; append +ffont to change its font (size,fontname,color); append +jjustify to change the text location relative to the beachball [Default is"TC", i.e., Top Center]; append +o to offset the text string by dx/dy.convention (
Literal['aki','gcmt','mt','partial','principal_axis'] |None, default:None) – Specify the focal mechanism convention of the input data. Ignored ifspecis a dict orpandas.DataFrame. See the table above for the supported conventions.component (
Literal['full','dc','deviatoric'], default:'full') –The component of the seismic moment tensor to plot. Valid values are:
"full": the full seismic moment tensor"dc": the closest double couple defined from the moment tensor (zero trace and zero determinant)"deviatoric": deviatoric part of the moment tensor (zero trace)
longitude/latitude/depth – Longitude(s), latitude(s), and depth(s) of the event(s). The length of each must match the number of events. These parameters are only used if
specis a dictionary or apandas.DataFrame, and they override any existinglongitude,latitude, ordepthvalues inspec.plot_longitude/plot_latitude – Longitude(s) and latitude(s) at which to place the beachball(s). The length of each must match the number of events. These parameters are only used if
specis a dictionary or apandas.DataFrame, and they override any existingplot_longitudeorplot_latitudevalues inspec.event_name (
str|Sequence[str] |None, default:None) – Text string(s), such as event name(s), to appear near the beachball(s). The length must match the number of events. This parameter is only used ifspecis a dictionary or apandas.DataFrame, and it overrides any existingevent_namelabels inspec.label_box (bool or str) – [fill]. Draw a box behind the label if given via
event_name. Use fill to give a fill color [Default is"white"].offset (bool or str) – [+ppen][+ssize]. Offset beachball(s) to the longitude(s) and latitude(s) specified in the last two columns of the input file or array, or by
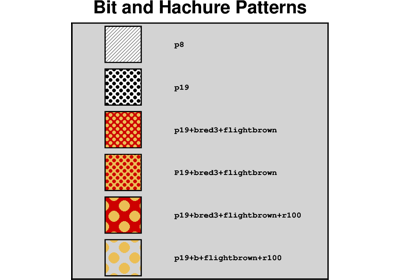
plot_longitudeandplot_latitudeif provided. A line from the beachball to the initial location is drawn. Use +ssize to plot a small circle at the initial location and to set the diameter of this circle [Default is no circle]. Use +ppen to set the pen attributes for this feature [Default is set viapen]. The fill of the circle is set viacompression_fillorcmap, i.e., corresponds to the fill of the compressive quadrants.compression_fill (str) – Set color or pattern for filling compressive quadrants [Default is
"black"]. This setting also applies to the fill of the circle defined viaoffset.extension_fill (str) – Set color or pattern for filling extensive quadrants [Default is
"white"].pen (str) – Set (default) pen attributes for all lines related to the beachball [Default is
"0.25p,black,solid"]. This setting applies tooutline,nodal, andoffset, unless overruled by arguments passed to those parameters. Draws the circumference of the beachball.outline (bool or str) – [pen]. Draw circumference and nodal planes of the beachball. Use pen to set the pen attributes for this feature [Default is set via
pen].[nplane][/pen]. Plot the nodal planes and outline the bubble which is transparent. If nplane is
0orTrue: both nodal planes are plotted [Default].1: only the first nodal plane is plotted.2: only the second nodal plane is plotted.
Use /pen to set the pen attributes for this feature [Default is set via
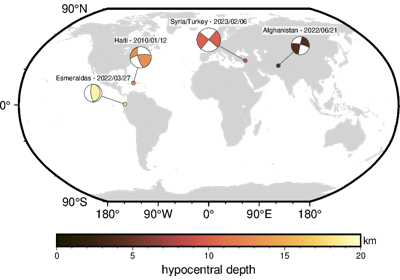
pen]. For double couple mechanisms,nodalrenders the beachball transparent by drawing only the nodal planes and the circumference. For non-double couple mechanisms,nodal=0overlays best double couple transparently.cmap (str) – File name of a CPT file or a series of comma-separated colors (e.g., color1,color2,color3) to build a linear continuous CPT from those colors automatically. The color of the compressive quadrants is determined by the z-value (i.e., event depth or the third column for an input file). This setting also applies to the fill of the circle defined via
offset.no_clip (
bool, default:False) – Do not skip symbols that fall outside the frame boundaries [Default isFalse, i.e., plot symbols inside the frame boundaries only].projection (
str|None, default:None) – projcode[projparams/]width|scale. Select map projection.region (str or list) – xmin/xmax/ymin/ymax[+r][+uunit]. Specify the region of interest.
frame (
Frame|Axis|Literal['none'] |str|Sequence[str] |bool, default:False) – Set frame and axes attributes for the plot. It can be a bool,"none", apygmt.params.Frameorpygmt.params.Axisobject. Raw GMT strings or sequences of strings are also supported for backward compatibility. Ifframe=True, the frame will be drawn with the default attributes. Ifframe="none", no frame will be drawn. Use apygmt.params.Frameorpygmt.params.Axisobject for more control over the attributes of the frame and axes. A tutorial is available at frame and axes attributes. Full documentation is at https://docs.generic-mapping-tools.org/6.6/gmt.html#b-full.verbose (bool or str) – Select verbosity level [Full usage].
panel (
int|Sequence[int] |bool, default:False) –Select a specific subplot panel. Only allowed when used in
Figure.subplotmode.Trueto advance to the next panel in the selected order.index to specify the index of the desired panel.
(row, col) to specify the row and column of the desired panel.
The panel order is determined by the
Figure.subplotmethod. row, col and index all start at 0.perspective (
float|Sequence[float] |str|bool, default:False) –Select perspective view and set the azimuth and elevation of the viewpoint.
Accepts a single value or a sequence of two or three values: azimuth, (azimuth, elevation), or (azimuth, elevation, zlevel).
azimuth: Azimuth angle of the viewpoint in degrees [Default is 180, i.e., looking from south to north].
elevation: Elevation angle of the viewpoint above the horizon [Default is 90, i.e., looking straight down at nadir].
zlevel: Z-level at which 2-D elements (e.g., the plot frame) are drawn. Only applied when used together with
zsizeorzscale. [Default is at the bottom of the z-axis].
Alternatively, set
perspective=Trueto reuse the perspective setting from the previous plotting method, or pass a string following the full GMT syntax for finer control (e.g., adding+wor+vmodifiers to select an axis location other than the plot origin). See https://docs.generic-mapping-tools.org/6.6/gmt.html#perspective-full for details.transparency (float) – Set transparency level, in [0-100] percent range [Default is
0, i.e., opaque]. Only visible when PDF or raster format output is selected. Only the PNG format selection adds a transparency layer in the image (for further processing).