pygmt.Figure.plot
- Figure.plot(data=None, x=None, y=None, size=None, symbol=None, direction=None, straight_line=False, projection=None, region=None, frame=False, verbose=False, panel=False, incols=None, perspective=False, transparency=None, **kwargs)
Plot lines, polygons, and symbols in 2-D.
Takes a matrix, (x,y) pairs, or a file name as input and plots lines, polygons, or symbols at those locations on a plot.
Must provide either
dataorx/y.If providing data through
x/y,fillcan be a 1-D array that will be mapped to a colormap.If a symbol is selected and no symbol size given, then plot will interpret the third column of the input data as symbol size. Symbols whose size is <= 0 are skipped. If no symbols are specified then the symbol code (see
stylebelow) must be present as last column in the input. Ifstyleis not used, a line connecting the data points will be drawn instead. To explicitly close polygons, useclose. Select a fill withfill. Iffillis set,penwill control whether the polygon outline is drawn or not. If a symbol is selected,fillandpendetermine the fill and outline/no outline, respectively.Full GMT docs at https://docs.generic-mapping-tools.org/6.6/plot.html.
Aliases:
C = cmap
D = offset
E = error_bar
F = connection
G = fill
I = intensity
L = close
N = no_clip
S = style
W = pen
Z = zvalue
a = aspatial
b = binary
d = nodata
e = find
f = coltypes
g = gap
h = header
l = label
w = wrap
A = straight_line
B = frame
J = projection
R = region
V = verbose
c = panel
i = incols
p = perspective
t = transparency
- Parameters:
data (
str|PathLike|dict|ndarray|DataFrame|Dataset|GeoDataFrame|None, default:None) – Pass in either a file name to an ASCII data table, a 2-Dnumpy.ndarray, apandas.DataFrame, anxarray.Datasetmade up of 1-Dxarray.DataArraydata variables, or ageopandas.GeoDataFramecontaining the tabular data. Use parameterincolsto choose which columns are x, y, fill, and size, respectively.x/y (float or 1-D arrays) – The x and y coordinates, or arrays of x and y coordinates of the data points
size (1-D array) – The size of the data points in units specified using
style. Only valid if usingx/y.symbol (1-D array) – The symbols of the data points. Only valid if using
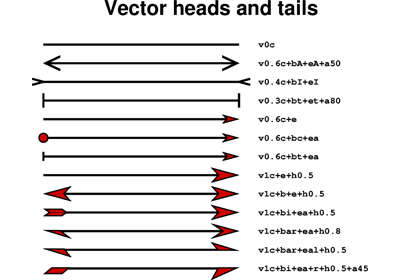
x/y.direction (list of two 1-D arrays) – If plotting vectors (using
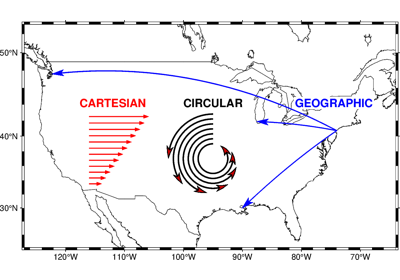
style="V"orstyle="v"), then should be a list of two 1-D arrays with the vector directions. These can be angle and length, azimuth and length, or x and y components, depending on the style options chosen.straight_line (
bool|Literal['x','y'], default:False) –By default, line segments are drawn as straight lines in the Cartesian and polar coordinate systems, and as great circle arcs (by resampling coarse input data along such arcs) in the geographic coordinate system. The
straight_lineparameter can control the drawing of line segments. Valid values are:True: Draw line segments as straight lines in geographic coordinate systems."x": Draw line segments by first along x, then along y."y": Draw line segments by first along y, then along x.
Here, x and y have different meanings depending on the coordinate system:
Cartesian coordinate system: x and y are the X- and Y-axes.
Polar coordinate system: x and y are theta and radius.
Geographic coordinate system: x and y are parallels and meridians.
Attention
There exits a bug in GMT<=6.5.0 that, in geographic coordinate systems, the meaning of x and y is reversed, i.e., x means meridians and y means parallels. The bug is fixed by upstream PR #8648.
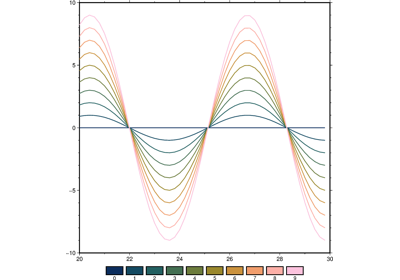
cmap (str) – File name of a CPT file or a series of comma-separated colors (e.g., color1,color2,color3) to build a linear continuous CPT from those colors automatically.
offset (str) – dx/dy. Offset the plot symbol or line locations by the given amounts dx/dy [Default is no offset]. If dy is not given it is set equal to dx.
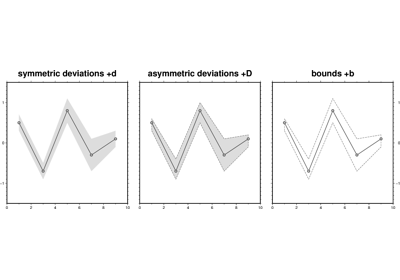
error_bar (bool or str) – [x|y|X|Y][+a|A][+cl|f][+n][+wcap][+ppen]. Draw error bars. Full documentation is at https://docs.generic-mapping-tools.org/6.6/plot.html#e.
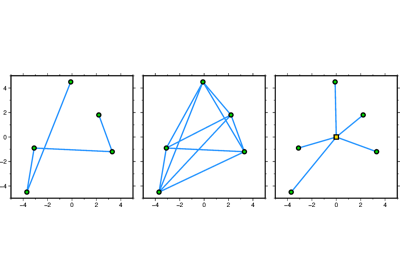
connection (str) –
[c|n|p][a|r|s|t|refpoint]. Alter the way points are connected (by specifying a scheme) and data are grouped (by specifying a method). Append one of three line connection schemes:
c: Draw continuous line segments for each group [Default].
n: Draw networks of line segments between all points in each group.
p: Draw line segments from a reference point reset for each group.
Optionally, append the one of four segmentation methods to define the group:
a: Ignore all segment headers, i.e., let all points belong to a single group, and set group the reference point to the very first point of the first file.
r: Segment headers are honored so each segment is a group; the group reference point is reset after each record to the previous point (this method is only available with the
connection="p"scheme).s: Same as r, but the group reference point is reset to the first point of each incoming segment [Default].
t: Consider all data in each file to be a single separate group and reset the group reference point to the first point of each group.
Instead of the codes a|r|s|t you may append the coordinates of a refpoint which will serve as a fixed external reference point for all groups.
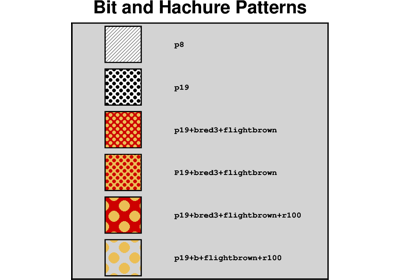
fill (str) – Set color or pattern for filling symbols or polygons [Default is no fill]. fill can be a 1-D array, but it is only valid if using
x/yandcmap=Trueis also required.intensity (float, bool, or 1-D array) – Provide an intensity value (nominally in the -1 to +1 range) to modulate the fill color by simulating illumination. If using
intensity=True, we will instead read intensity from the first data column after the symbol parameters (if given). intensity can also be a 1-D array to set varying intensity for symbols, but it is only valid forx/ypairs.close (str) – [+b|d|D][+xl|r|x0][+yl|r|y0][+ppen]. Force closed polygons. Full documentation is at https://docs.generic-mapping-tools.org/6.6/plot.html#l.
no_clip (bool or str) – [c|r]. Do not clip symbols that fall outside the frame boundaries [Default plots points whose coordinates are strictly inside the frame boundaries only]. The parameter does not apply to lines and polygons which are always clipped to the plot region. For periodic (360-longitude) maps we must plot all symbols twice in case they are clipped by the repeating boundary.
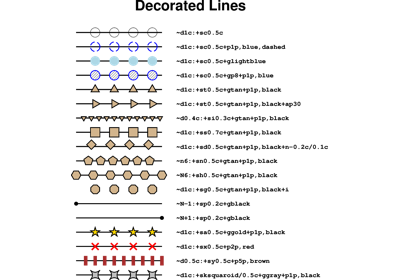
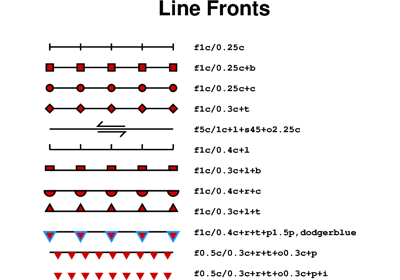
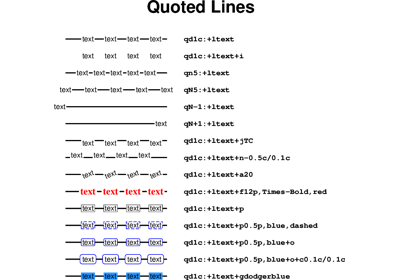
no_clip=Truewill turn off clipping and not plot repeating symbols. Useno_clip="r"to turn off clipping but retain the plotting of such repeating symbols, or useno_clip="c"to retain clipping but turn off plotting of repeating symbols.style (str) – Plot symbols (including vectors, pie slices, fronts, decorated or quoted lines).
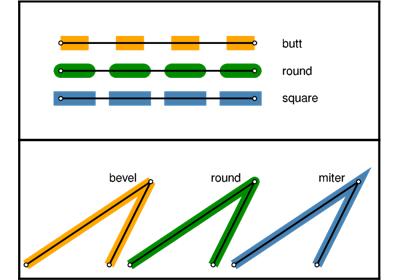
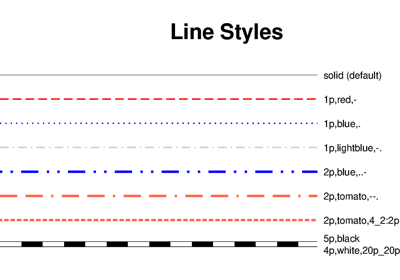
pen (str) – Set pen attributes for lines or the outline of symbols.
zvalue (str) – value|file. Instead of specifying a symbol or polygon fill and outline color via
fillandpen, give both a value viazvalueand a color lookup table viacmap. Alternatively, give the name of a file with one z-value (read from the last column) for each polygon in the input data. To apply it to the fill color, usefill="+z". To apply it to the pen color, append +z topen.projection (
str|None, default:None) – projcode[projparams/]width|scale. Select map projection.region (str or list) – xmin/xmax/ymin/ymax[+r][+uunit]. Specify the region of interest.
frame (
Frame|Axis|Literal['none'] |str|Sequence[str] |bool, default:False) – Set frame and axes attributes for the plot. It can be a bool,"none", apygmt.params.Frameorpygmt.params.Axisobject. Raw GMT strings or sequences of strings are also supported for backward compatibility. Ifframe=True, the frame will be drawn with the default attributes. Ifframe="none", no frame will be drawn. Use apygmt.params.Frameorpygmt.params.Axisobject for more control over the attributes of the frame and axes. A tutorial is available at frame and axes attributes. Full documentation is at https://docs.generic-mapping-tools.org/6.6/gmt.html#b-full.verbose (bool or str) – Select verbosity level [Full usage].
aspatial (bool or str) – [col=]name[,…]. Control how aspatial data are handled during input and output. Full documentation is at https://docs.generic-mapping-tools.org/6.6/gmt.html#aspatial-full.
i|o[ncols][type][w][+l|b]. Select native binary input (using
binary="i") or output (usingbinary="o"), where ncols is the number of data columns of type, which must be one of:c: int8_t (1-byte signed char)
u: uint8_t (1-byte unsigned char)
h: int16_t (2-byte signed int)
H: uint16_t (2-byte unsigned int)
i: int32_t (4-byte signed int)
I: uint32_t (4-byte unsigned int)
l: int64_t (8-byte signed int)
L: uint64_t (8-byte unsigned int)
f: 4-byte single-precision float
d: 8-byte double-precision float
x: use to skip ncols anywhere in the record
For records with mixed types, append additional comma-separated combinations of ncols type (no space). The following modifiers are supported:
w after any item to force byte-swapping.
+l|b to indicate that the entire data file should be read as little- or big-endian, respectively.
Full documentation is at https://docs.generic-mapping-tools.org/6.6/gmt.html#bi-full.
panel (
int|Sequence[int] |bool, default:False) –Select a specific subplot panel. Only allowed when used in
Figure.subplotmode.Trueto advance to the next panel in the selected order.index to specify the index of the desired panel.
(row, col) to specify the row and column of the desired panel.
The panel order is determined by the
Figure.subplotmethod. row, col and index all start at 0.nodata (str) – i|onodata. Substitute specific values with NaN (for tabular data). For example,
nodata="-9999"will replace all values equal to -9999 with NaN during input and all NaN values with -9999 during output. Prepend i to the nodata value for input columns only. Prepend o to the nodata value for output columns only.find (str) – [~]“pattern” | [~]/regexp/[i]. Only pass records that match the given pattern or regular expressions [Default processes all records]. Prepend ~ to the pattern or regexp to instead only pass data expressions that do not match the pattern. Append i for case insensitive matching. This does not apply to headers or segment headers.
coltypes (str) – [i|o]colinfo. Specify data types of input and/or output columns (time or geographical data). Full documentation is at https://docs.generic-mapping-tools.org/6.6/gmt.html#f-full.
x|y|z|d|X|Y|Dgap[u][+a][+ccol][+n|p]. Examine the spacing between consecutive data points in order to impose breaks in the line. To specify multiple criteria, provide a list with each item containing a string describing one set of criteria.
x|X: define a gap when there is a large enough change in the x coordinates (uppercase to use projected coordinates).
y|Y: define a gap when there is a large enough change in the y coordinates (uppercase to use projected coordinates).
d|D: define a gap when there is a large enough distance between coordinates (uppercase to use projected coordinates).
z: define a gap when there is a large enough change in the z data. Use +ccol to change the z data column [Default col is 2 (i.e., 3rd column)].
A unit u may be appended to the specified gap:
For geographic data (x|y|d), the unit may be arc- d(egrees), m(inutes), and s(econds), or (m)e(ters), f(eet), k(ilometers), M(iles), or n(autical miles) [Default is (m)e(ters)].
For projected data (X|Y|D), the unit may be i (inches), c (centimeters), or p (points).
Append modifier +a to specify that all the criteria must be met [default imposes breaks if any one criterion is met].
One of the following modifiers can be appended:
+n: specify that the previous value minus the current column value must exceed gap for a break to be imposed.
+p: specify that the current value minus the previous value must exceed gap for a break to be imposed.
header (str) –
[i|o][n][+c][+d][+msegheader][+rremark][+ttitle]. Specify that input and/or output file(s) have n header records [Default is 0]. Prepend i if only the primary input should have header records. Prepend o to control the writing of header records, with the following modifiers supported:
+d to remove existing header records.
+c to add a header comment with column names to the output [Default is no column names].
+m to add a segment header segheader to the output after the header block [Default is no segment header].
+r to add a remark comment to the output [Default is no comment]. The remark string may contain \n to indicate line-breaks.
+t to add a title comment to the output [Default is no title]. The title string may contain \n to indicate line-breaks.
Blank lines and lines starting with # are always skipped.
incols (
int|str|Sequence[int|str] |None, default:None) –Specify data columns for primary input in arbitrary order. Columns can be repeated and columns not listed will be skipped [Default reads all columns in order, starting with the first (i.e., column 0)].
For a sequence: specify individual columns in input order (e.g.,
incols=(1, 0)for the 2nd column followed by the 1st column).For a string: specify individual columns or column ranges in the format start[:inc]:stop, where inc defaults to 1 if not specified, with columns and/or column ranges separated by commas (e.g.,
incols="0:2,4+l"to input the first three columns followed by the log10-transformed 5th column). To read from a given column until the end of the record, leave off stop when specifying the column range. To read trailing text, add the column t. Append the word number to t to ingest only a single word from the trailing text. Instead of specifying columns, useincols="n"to simply read numerical input and skip trailing text. Optionally, append one of the following modifiers to any column or column range to transform the input columns:+l to take the log10 of the input values.
+d to divide the input values by the factor divisor [Default is 1].
+s to multiple the input values by the factor scale [Default is 1].
+o to add the given offset to the input values [Default is 0].
label (str) – Add a legend entry for the symbol or line being plotted. Full documentation is at https://docs.generic-mapping-tools.org/6.6/gmt.html#l-full.
perspective (
float|Sequence[float] |str|bool, default:False) –Select perspective view and set the azimuth and elevation of the viewpoint.
Accepts a single value or a sequence of two or three values: azimuth, (azimuth, elevation), or (azimuth, elevation, zlevel).
azimuth: Azimuth angle of the viewpoint in degrees [Default is 180, i.e., looking from south to north].
elevation: Elevation angle of the viewpoint above the horizon [Default is 90, i.e., looking straight down at nadir].
zlevel: Z-level at which 2-D elements (e.g., the plot frame) are drawn. Only applied when used together with
zsizeorzscale. [Default is at the bottom of the z-axis].
Alternatively, set
perspective=Trueto reuse the perspective setting from the previous plotting method, or pass a string following the full GMT syntax for finer control (e.g., adding+wor+vmodifiers to select an axis location other than the plot origin). See https://docs.generic-mapping-tools.org/6.6/gmt.html#perspective-full for details.transparency (float) – Set transparency level, in [0-100] percent range [Default is
0, i.e., opaque]. Only visible when PDF or raster format output is selected. Only the PNG format selection adds a transparency layer in the image (for further processing).transparencycan also be a 1-D array to set varying transparency for symbols, but this option is only valid if usingx/y.wrap (str) –
y|a|w|d|h|m|s|cperiod[/phase][+ccol]. Convert the input x-coordinate to a cyclical coordinate, or a different column if selected via +ccol. The following cyclical coordinate transformations are supported:
y: yearly cycle (normalized)
a: annual cycle (monthly)
w: weekly cycle (day)
d: daily cycle (hour)
h: hourly cycle (minute)
m: minute cycle (second)
s: second cycle (second)
c: custom cycle (normalized)
Full documentation is at https://docs.generic-mapping-tools.org/6.6/gmt.html#w-full.
See also
pygmt.Figure.choroplethPlot a choropleth map.
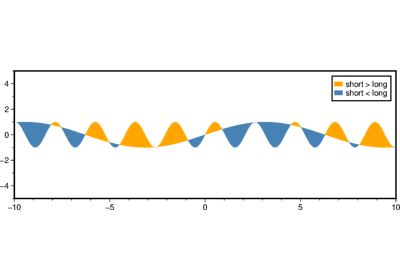
pygmt.Figure.fill_betweenFill the area between two curves.
pygmt.Figure.hlinesPlot horizontal lines.
pygmt.Figure.vlinesPlot vertical lines.
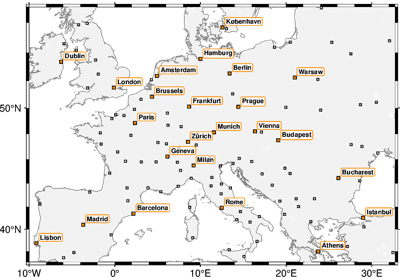
Examples using pygmt.Figure.plot
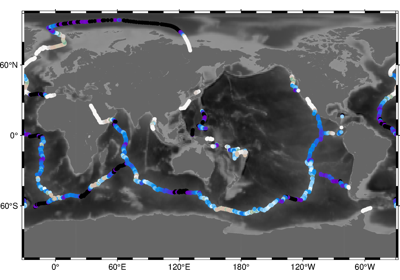
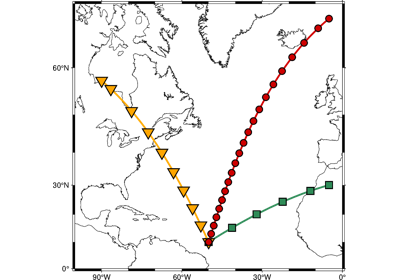
GeoPandas: Plotting lines with LineString or MultiLineString geometry


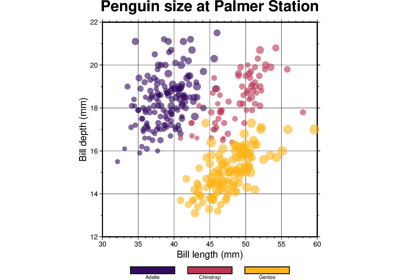
GeoPandas: Plotting points with Point or MultiPoint geometry