Note
Go to the end to download the full example code.
RGB image
The pygmt.Figure.grdimage method can be used to plot Red, Green, Blue
(RGB) images, or any 3-band false color combination. Here, we’ll use
rioxarray.open_rasterio to read a GeoTIFF file into an
xarray.DataArray format, and plot it on a map.
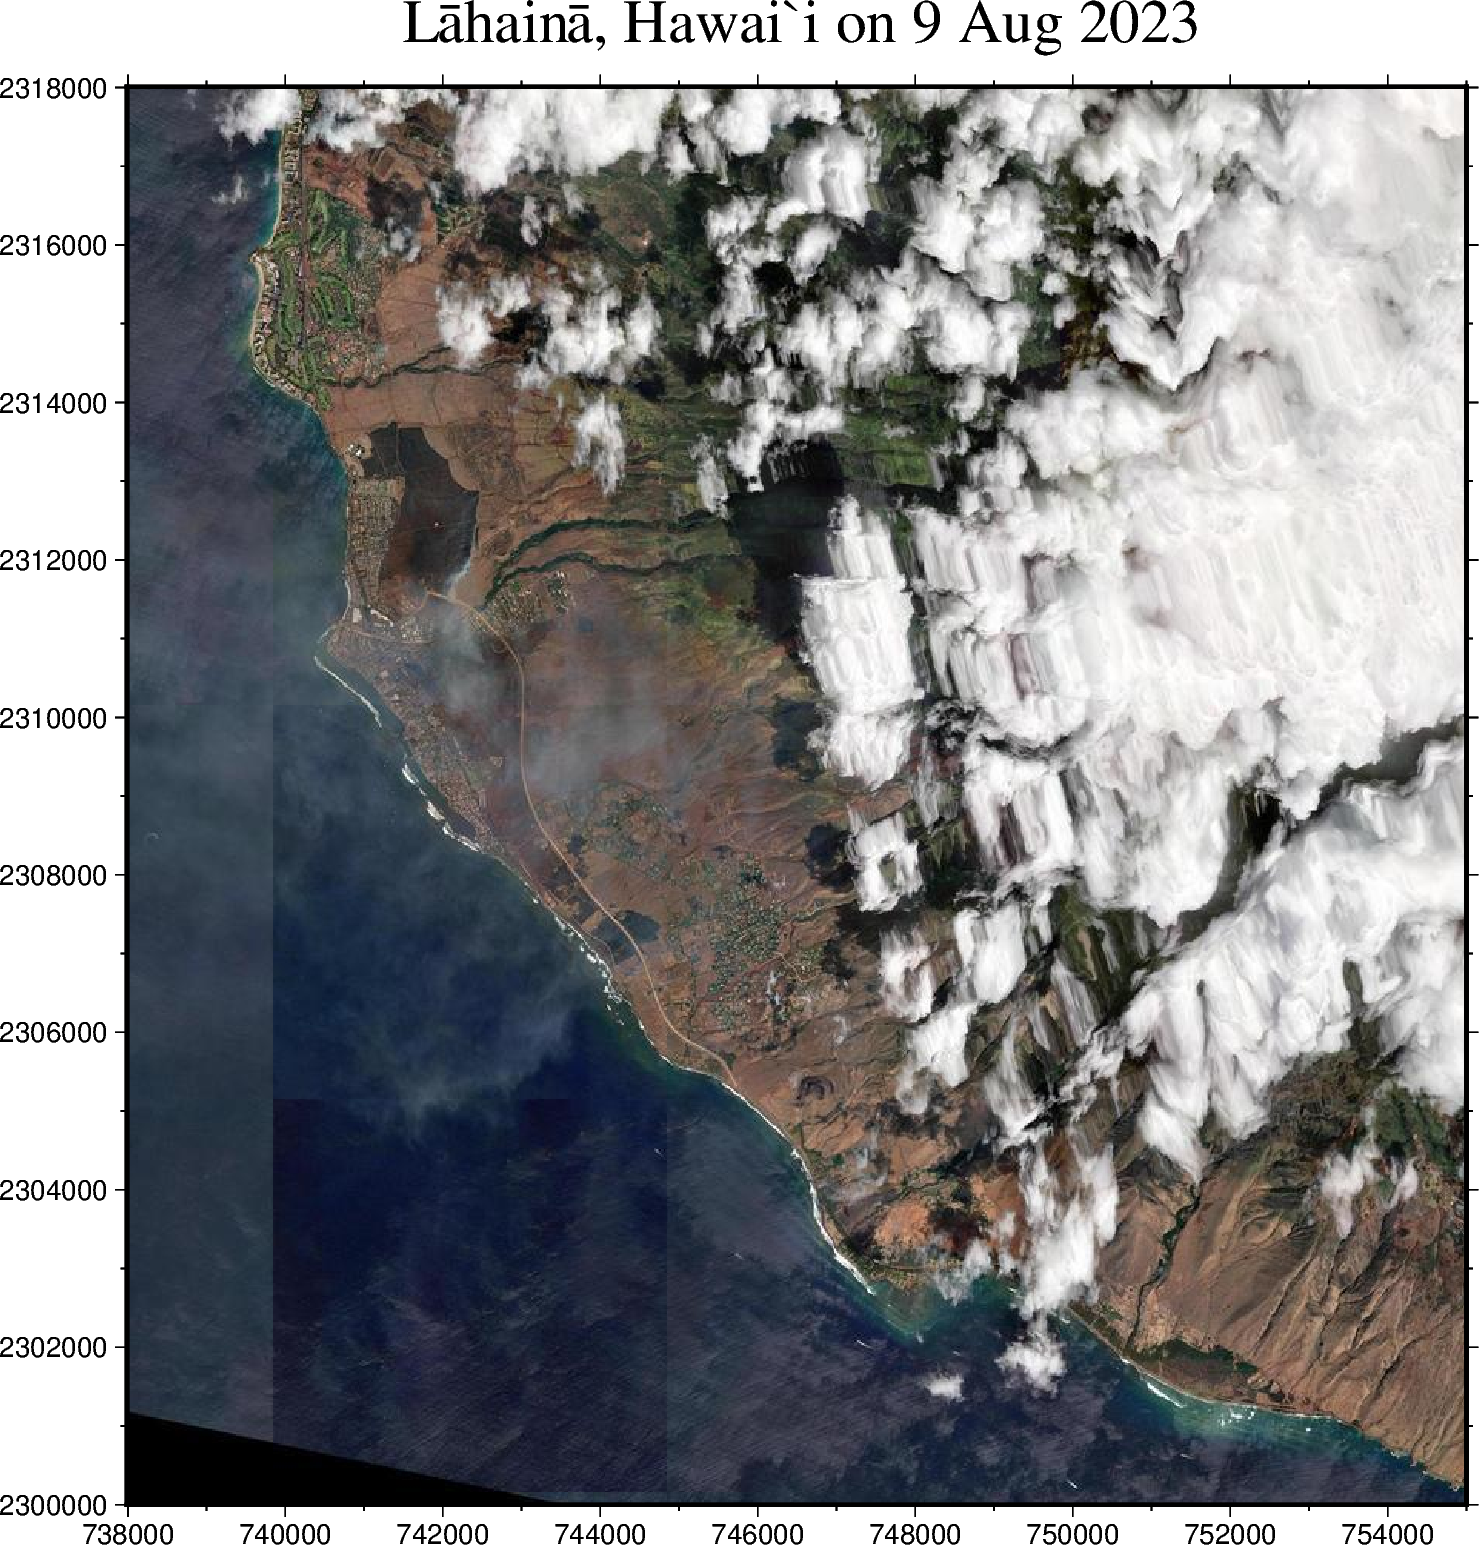
The example below shows a Worldview 2 satellite image over Lāhainā, Hawaiʻi during the August 2023 wildfires. Data is sourced from a Cloud-Optimized GeoTIFF (COG) file hosted on OpenAerialMap under a CC BY-NC 4.0 license.
Read 3-band data from GeoTIFF into an xarray.DataArray object:
with rioxarray.open_rasterio(
    filename="https://oin-hotosm-temp.s3.us-east-1.amazonaws.com/64d6a49a19cb3a000147a65b/0/64d6a49a19cb3a000147a65c.tif",
    overview_level=5,
) as img:
    # Subset to area of Lāhainā in EPSG:32604 coordinates
    image = img.rio.clip_box(minx=738000, maxx=755000, miny=2300000, maxy=2318000)
    image = image.load()  # Force loading the DataArray into memory
image
Plot the RGB imagery:
fig = pygmt.Figure()
with pygmt.config(FONT_TITLE="Times-Roman"):  # Set title font to Times-Roman
    fig.grdimage(
        grid=image,
        # Use a map scale where 1 cm on the map equals 1 km on the ground
        projection="x1:100000",
        frame=Frame(
            axes="WSne",
            title=r"L@!a¯hain@!a¯, Hawai`i on 9 Aug 2023",
            axis=Axis(annot=True, tick=True),
        ),
    )
fig.show()
Total running time of the script: (0 minutes 1.639 seconds)