Note
Go to the end to download the full example code.
Contours
The pygmt.Figure.contour method can plot contour lines from a table of
points by direct triangulation. The data for the triangulation can be provided
using one of three methods:
x,y,z1-Dnumpy.ndarraydata columns.data2-Dnumpy.ndarraydata matrix with 3 columns corresponding tox,y,z.datapath string to a file containing thex,y,zin a tabular format.
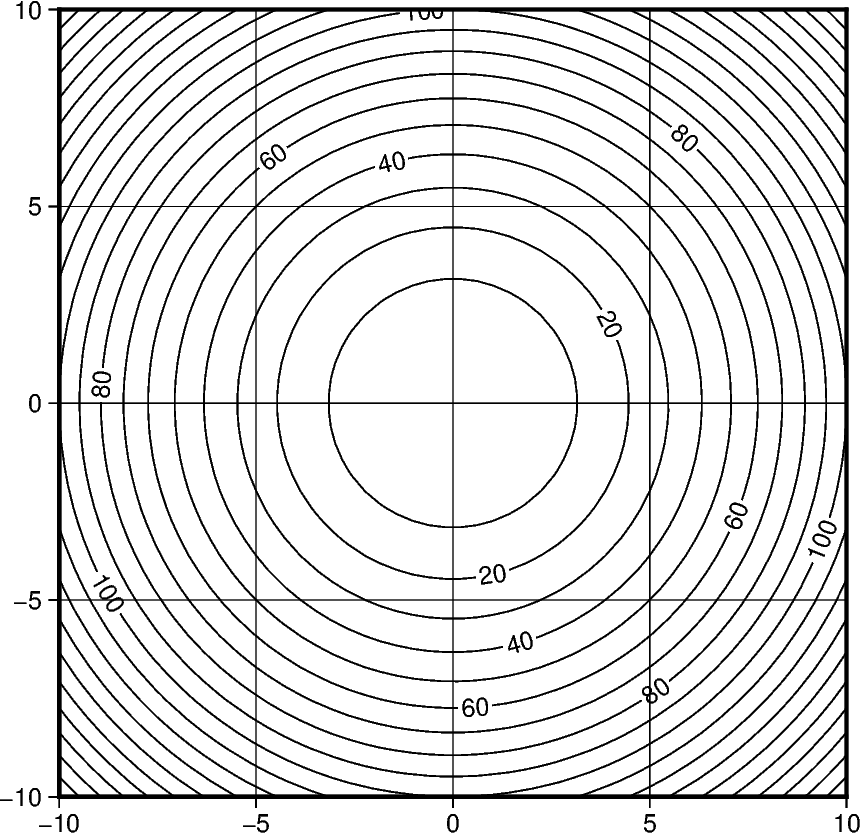
The parameters levels and annotation set the intervals of the contours
and the annotations on the contours, respectively.
In this example we supply the data as 1-D numpy.ndarray with the x,
y, and z parameters and draw the contours using a 0.5-points pen with
contours every 10 z-values and annotations every 20 z-values.
import numpy as np
import pygmt
from pygmt.params import Axis

# Build the contours underlying data with the function z = x^2 + y^2
X, Y = np.meshgrid(np.linspace(-10, 10, 50), np.linspace(-10, 10, 50))
Z = X**2 + Y**2
x, y, z = X.flatten(), Y.flatten(), Z.flatten()


fig = pygmt.Figure()
fig.contour(
    region=[-10, 10, -10, 10],
    projection="X10c/10c",
    frame=Axis(annot=True, grid=True),
    pen="0.5p",
    # Pass the data as 3 1-D data columns
    x=x,
    y=y,
    z=z,
    # Set the interval of the contours to 10
    levels=10,
    # Set the interval of the annotations to 20
    annotation=20,
)
fig.show()
Total running time of the script: (0 minutes 0.216 seconds)