PyGMT

dev

Getting Started

  • Overview
  • Installing
  • Intro to PyGMT

User Guide

  • Tutorials
  • Gallery
    • Maps and map elements
    • Lines and vectors
    • Symbols and markers
    • Images, contours, and fields
    • 3D Plots
    • Seismology and geodesy
    • Base maps
    • Histograms
    • Plot embellishments
      • Colorbar
      • Day-night terminator and twilights
      • GMT logo
      • Inset
      • Inset map showing a rectangular region
      • Legend
      • Multiple colormaps
      • Scale bar
      • Timestamp
  • Projections
  • External Resources

Reference Documentation

  • API Reference
  • Technical Reference
  • Changelog
  • Minimum Supported Versions
  • Ecosystem

Development

  • PyGMT Team
  • Contributors Guide
  • Maintainers Guide

Getting help and contributing

  • Code of Conduct
  • License
  • Contact
  • Source Code
PyGMT
  • Gallery
  • GMT logo
  • Improve this page

Note

Go to the end to download the full example code.

GMT logo

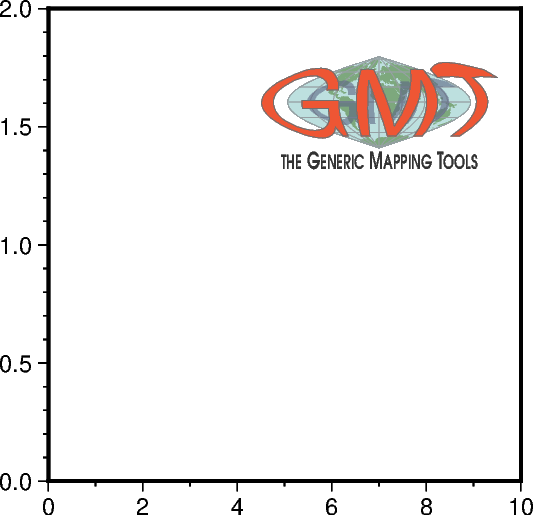
The pygmt.Figure.logo method allows to place the GMT logo on a figure.
gmt logo
import pygmt

fig = pygmt.Figure()
fig.basemap(region=[0, 10, 0, 2], projection="X6c", frame=True)

# Add the GMT logo in the Top Right (TR) corner of the current plot, scaled up to be 3
# centimeters wide and offset by 0.3 cm in x direction and 0.6 cm in y direction.
fig.logo(position="jTR+o0.3c/0.6c+w3c")

fig.show()

Total running time of the script: (0 minutes 0.215 seconds)

Download Jupyter notebook: gmt_logo.ipynb

Download Python source code: gmt_logo.py

Download zipped: gmt_logo.zip

Gallery generated by Sphinx-Gallery

Previous Next

© Copyright 2017-2025, The PyGMT Developers. Revision 528cf2ae. Last updated on May 15, 2025.

Built with Sphinx using a theme provided by Read the Docs

This website uses Google Analytics to gather usage statistics. However, it does not use cookies or track you across different websites. Page view data are used to help us improve the site and provide an estimate of the software usage.