Note
Go to the end to download the full example code.
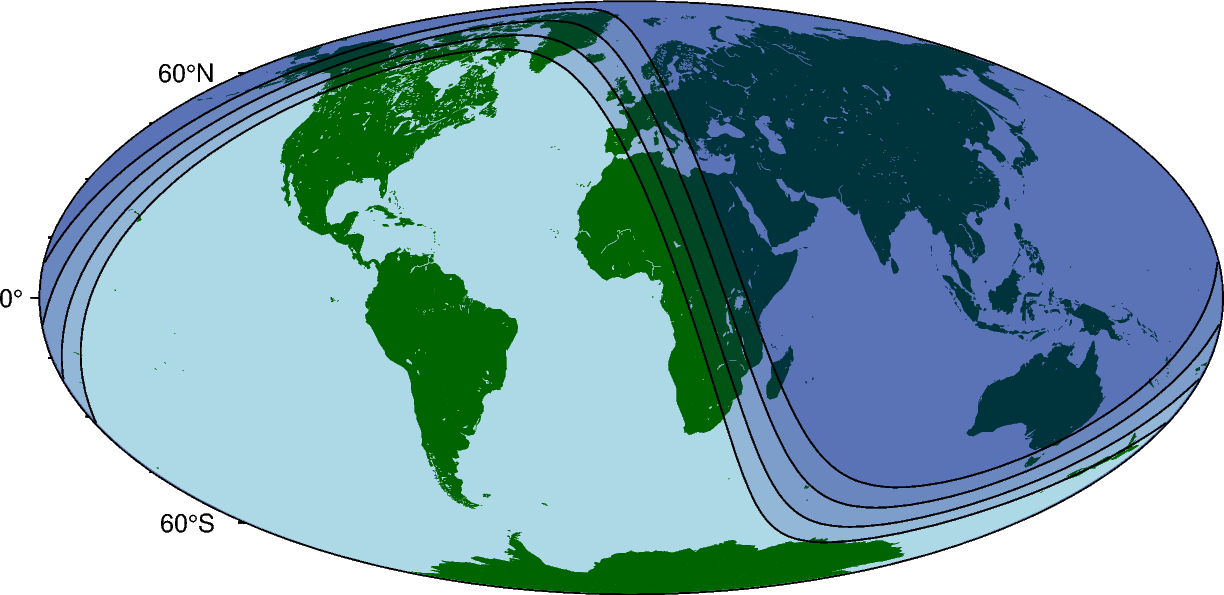
Day-night terminator and twilights
Use pygmt.Figure.solar to show the different transition stages between daytime
and nighttime. The parameter terminator is used to set the twilight stage, and can
be either "day_night" (brightest), "civil", "nautical", or
"astronomical" (darkest). Refer to https://en.wikipedia.org/wiki/Twilight for more
information.
import datetime

import pygmt

fig = pygmt.Figure()
# Create a global map using the Mollweide projection, centered at 0°E, with a width of
# 15 centimeters.
fig.basemap(region="d", projection="W15c", frame=True)
fig.coast(land="darkgreen", water="lightblue")

# Set a time for the day-night terminator and twilights to 17:00 UTC on January 1, 2000
reference_time = datetime.datetime(
    year=2000, month=1, day=1, hour=17, minute=0, second=0
)

# Plot the day-night terminator and twilights
for terminator in ["day_night", "civil", "nautical", "astronomical"]:
    fig.solar(
        terminator=terminator,
        terminator_datetime=reference_time,
        # Set the fill for the night area to navy blue with 85 % transparency
        fill="navyblue@85",
        pen="0.5p",  # Set the outline to be 0.5-point thick
    )

fig.show()
Total running time of the script: (0 minutes 0.362 seconds)