Note
Go to the end to download the full example code.
4. PyGMT I/O: Table inputs
Generally, PyGMT accepts two different types of data inputs: tables and grids.
A table is a 2-D array with rows and columns. Each column represents a different variable (e.g., x, y and z) and each row represents a different record.
A grid is a 2-D array of data that is regularly spaced in the x and y directions (or longitude and latitude).
In this tutorial, we’ll focus on working with table inputs, and cover grid inputs in a separate tutorial.
PyGMT supports a variety of table input types that allow you to work with data in a format that suits your needs. In this tutorial, we’ll explore the different table input types available in PyGMT and provide examples for each. By understanding the different table input types, you can choose the one that best fits your data and analysis needs, and work more efficiently with PyGMT.
from pathlib import Path

import geopandas as gpd
import numpy as np
import pandas as pd
import pygmt
ASCII table file
Most PyGMT functions/methods that accept table input data have a data parameter.
The easiest way to provide table input data to PyGMT is by specifying the file name of
an ASCII table (e.g., data="input_data.dat"). This is useful when your data is
stored in a separate text file.
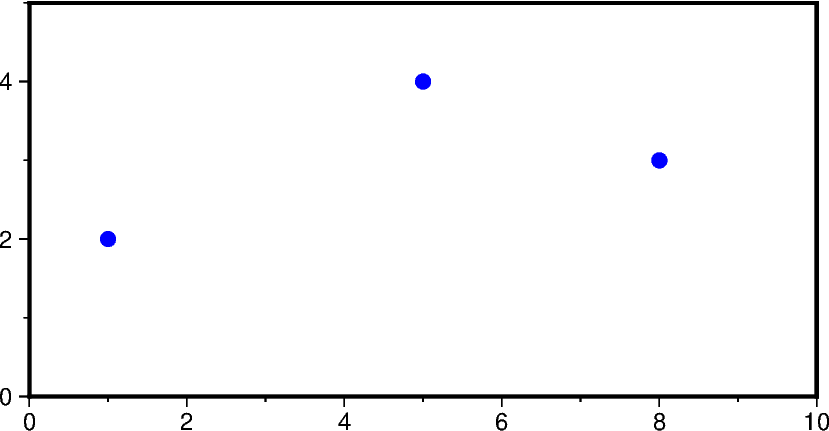
# Create an example file with 3 rows and 2 columns
data = np.array([[1.0, 2.0], [5.0, 4.0], [8.0, 3.0]])
np.savetxt("input_data.dat", data, fmt="%f")

# Pass the file name to the data parameter
fig = pygmt.Figure()
fig.basemap(region=[0, 10, 0, 5], projection="X10c/5c", frame=True)
fig.plot(data="input_data.dat", style="p0.2c", fill="blue")
fig.show()

# Now let's delete the example file
Path("input_data.dat").unlink()
Besides a plain string to a table file, the following variants are also accepted:
A
pathlib.Pathobject.A full URL. PyGMT will download the file to the current directory first.
A file name prefixed with
@(e.g.,data="@input_data.dat"), which is a special syntax in GMT to indicate that the file is a remote file hosted on the GMT data server.
Additionally, PyGMT also supports a list of file names, pathlib.Path objects,
URLs, or remote files, to provide more flexibility in specifying input files.
2-D array: list, numpy.ndarray, and pandas.DataFrame
The data parameter also accepts a 2-D array, e.g.,
A 2-D
list(i.e., a list of lists)A
numpy.ndarrayobject with with a dimension of 2A
pandas.DataFrameobject
This is useful when you want to plot data that is already in memory.
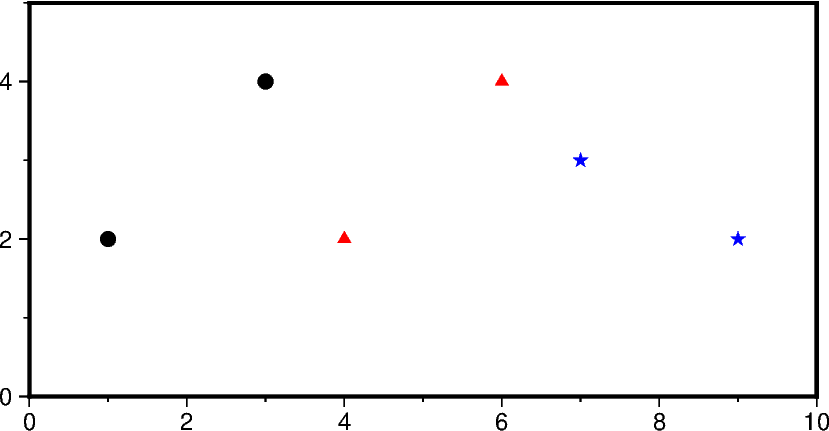
fig = pygmt.Figure()
fig.basemap(region=[0, 10, 0, 5], projection="X10c/5c", frame=True)

# Pass a 2-D list to the 'data' parameter
fig.plot(data=[[1.0, 2.0], [3.0, 4.0]], style="c0.2c", fill="black")

# Pass a 2-D numpy array to the 'data' parameter
fig.plot(data=np.array([[4.0, 2.0], [6.0, 4.0]]), style="t0.2c", fill="red")

# Pass a pandas.DataFrame to the 'data' parameter
df = pd.DataFrame(np.array([[7.0, 3.0], [9.0, 2.0]]), columns=["x", "y"])
fig.plot(data=df, style="a0.2c", fill="blue")

fig.show()
geopandas.GeoDataFrame
If you’re working with geospatial data, you can read your data as a
geopandas.GeoDataFrame object and pass it to the data parameter. This is
useful if your data is stored in a geospatial data format (e.g., GeoJSON, etc.) that
GMT and PyGMT do not support natively.
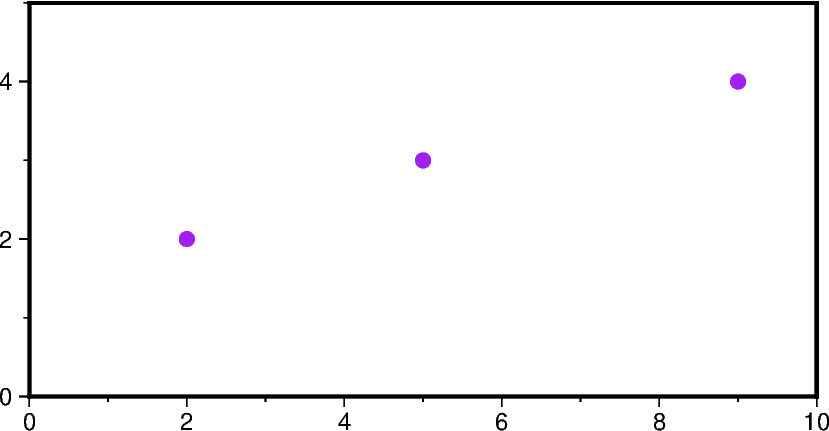
# Example GeoDataFrame
gdf = gpd.GeoDataFrame(
    {
        "geometry": gpd.points_from_xy([2, 5, 9], [2, 3, 4]),
        "value": [10, 20, 30],
    }
)

# Use the GeoDataFrame to specify the 'data' parameter
fig = pygmt.Figure()
fig.basemap(region=[0, 10, 0, 5], projection="X10c/5c", frame=True)
fig.plot(data=gdf, style="c0.2c", fill="purple")
fig.show()
Scalar values or 1-D arrays
In addition to the data parameter, some PyGMT functions/methods also provide
individual parameters (e.g., x and y for data coordinates) which allow you to
specify the data. These parameters accept individual scalar values or 1-D arrays
(lists or 1-D numpy arrays).
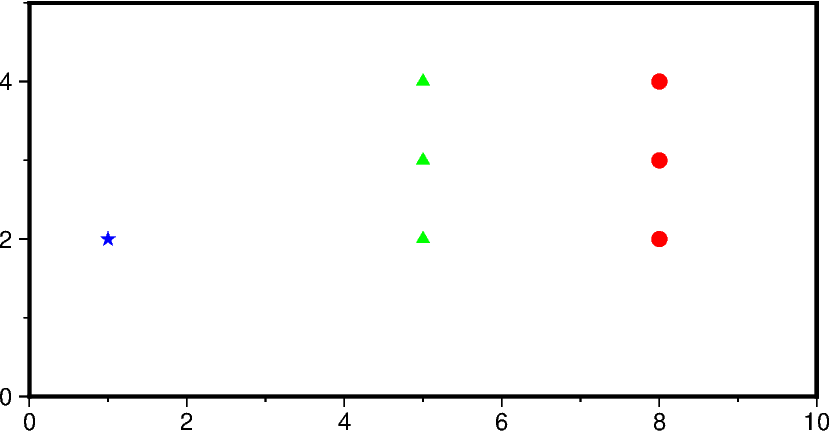
fig = pygmt.Figure()
fig.basemap(region=[0, 10, 0, 5], projection="X10c/5c", frame=True)

# Pass scalar values to plot a single data point
fig.plot(x=1.0, y=2.0, style="a0.2c", fill="blue")

# Pass 1-D lists to plot multiple data points
fig.plot(x=[5.0, 5.0, 5.0], y=[2.0, 3.0, 4.0], style="t0.2c", fill="green")

# Pass 1-D numpy arrays to plot multiple data points
fig.plot(
    x=np.array([8.0, 8.0, 8.0]), y=np.array([2.0, 3.0, 4.0]), style="c0.2c", fill="red"
)

fig.show()
Conclusion
In PyGMT, you have the flexibility to provide data in various table input types,
including file names, 2-D arrays (2-D list, numpy.ndarray,
pandas.DataFrames), scalar values or a series of 1-D arrays, and
geopandas.GeoDataFrame. Choose the input type that best suits your data
source and analysis requirements.
Total running time of the script: (0 minutes 0.463 seconds)