Note
Go to the end to download the full example code.
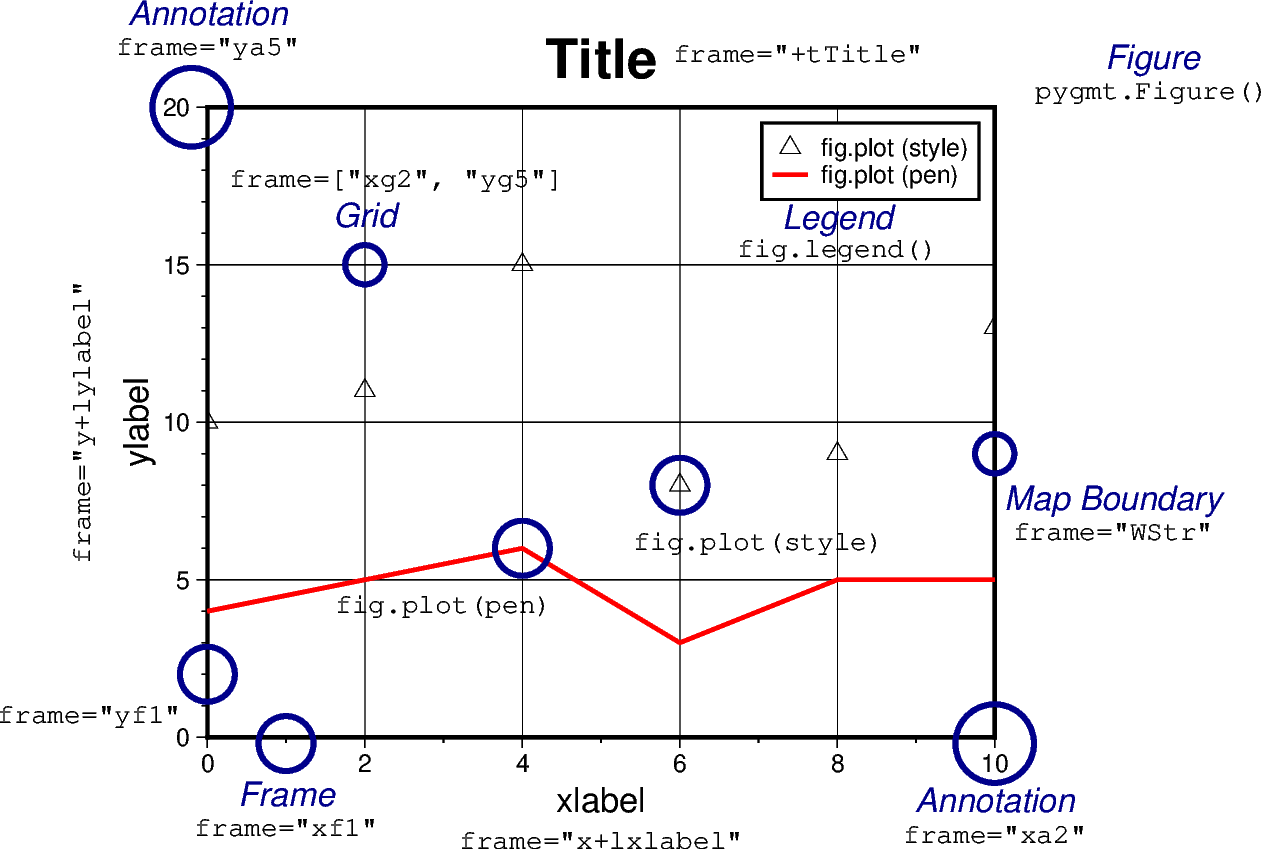
3. Figure elements
The figure below shows the naming of figure elements in PyGMT.
pygmt.Figure: having a number of plotting methods. Every new figure must start with the creation of apygmt.Figureinstanceframe: setting plot or map boundaries (a combination of the single letters of WSNE, wsne, or lbtr), adding annotations, ticks, gridlines (afg), axis labels (+l), and title (+t), e.g., inpygmt.Figure.basemap. Detailed examples can be found at frame and axes attributespygmt.Figure.plot: plotting lines or symbols based onpenorstyleparameters, respectivelypygmt.Figure.text: plotting text strings whereby thefontparameter adjusts fontsize, fontstyle, and colorpygmt.Figure.legend: showing the naming of lines or symbols while thelabelis given inpygmt.Figure.plotpygmt.Figure.show: previewing the content added to the current figure instance
import pygmt

fig = pygmt.Figure()

x = range(0, 11, 2)
y_1 = [10, 11, 15, 8, 9, 13]
y_2 = [4, 5, 6, 3, 5, 5]

fig.basemap(
    region=[0, 10, 0, 20],
    projection="X10c/8c",
    frame=["WStr+tTitle", "xa2f1g2+lxlabel", "ya5f1g5+lylabel"],
)
fig.plot(x=x, y=y_1, style="t0.3c", label="fig.plot (style)")
fig.plot(x=x, y=y_2, pen="1.5p,red", label="fig.plot (pen)")

mainexplain = {"font": "12p,2,darkblue", "justify": "TC", "no_clip": True}
minorexplain = {"font": "10p,8", "justify": "TC", "no_clip": True}
# ============ Figure
fig.text(x=12, y=22, text="Figure", **mainexplain)
fig.text(x=12, y=20.8, text="pygmt.Figure()", **minorexplain)
# ============ Title
fig.text(x=7.5, y=22, text='frame="+tTitle"', **minorexplain)
# ============ xlabel
fig.text(x=5, y=-3, text='frame="x+lxlabel"', **minorexplain)
# ============ ylabel
fig.text(x=-1.7, y=10, text='frame="y+lylabel"', angle=90, **minorexplain)
# ============ x-majorticks
fig.plot(x=10, y=-0.2, style="c1c", pen="2p,darkblue", no_clip=True)
fig.text(x=10, y=-1.6, text="Annotation", **mainexplain)
fig.text(x=10, y=-2.8, text='frame="xa2"', **minorexplain)
# ============ y-majorticks
fig.plot(x=-0.2, y=20, style="c1c", pen="2p,darkblue", no_clip=True)
fig.text(x=0, y=23.4, text="Annotation", **mainexplain)
fig.text(x=0, y=22.2, text='frame="ya5"', **minorexplain)
# ============ x-minorticks
fig.plot(x=1, y=-0.2, style="c0.7c", pen="2p,darkblue", no_clip=True)
fig.text(x=1, y=-1.4, text="Frame", **mainexplain)
fig.text(x=1, y=-2.6, text='frame="xf1"', **minorexplain)
# ============ y-minorticks
fig.plot(x=0, y=2, style="c0.7c", pen="2p,darkblue", no_clip=True)
fig.text(x=-1.5, y=1, text='frame="yf1"', **minorexplain)
# ============ Grid
fig.plot(x=2, y=15, style="c0.5c", pen="2p,darkblue")
fig.text(x=2, y=17, text="Grid", **mainexplain)
fig.text(x=2.4, y=18, text='frame=["xg2", "yg5"]', **minorexplain)
# ============ Map Boundaries
fig.plot(x=10, y=9, style="c0.5c", pen="2p,darkblue", no_clip=True)
fig.text(x=11.5, y=8, text="Map Boundary", **mainexplain)
fig.text(x=11.5, y=6.8, text='frame="WStr"', **minorexplain)
# ============ fig.plot (style)
fig.plot(x=6, y=8, style="c0.7c", pen="2p,darkblue")
fig.text(x=7, y=6.5, text="fig.plot(style)", **minorexplain)
# ============ fig.plot (pen)
fig.plot(x=4, y=6, style="c0.7c", pen="2p,darkblue")
fig.text(x=3, y=4.5, text="fig.plot(pen)", **minorexplain)
# ============ Legend
fig.legend()
fig.text(x=8, y=16.9, text="Legend", **mainexplain)
fig.text(x=8, y=15.8, text="fig.legend()", **minorexplain)

fig.show()
Total running time of the script: (0 minutes 0.284 seconds)