pygmt.Figure.hlines
- Figure.hlines(y, xmin=None, xmax=None, pen=None, label=None, no_clip=False, perspective=None)
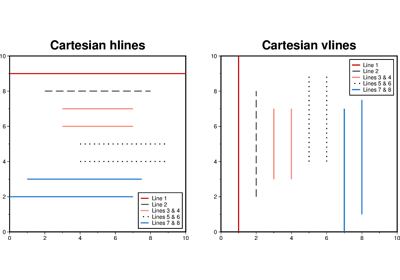
Plot one or multiple horizontal line(s).
This method is a high-level wrapper around
pygmt.Figure.plotthat focuses on plotting horizontal lines at Y-coordinates specified by theyparameter. Theyparameter can be a single value (for a single horizontal line) or a sequence of values (for multiple horizontal lines).By default, the X-coordinates of the start and end points of the lines are set to be the X-limits of the current plot, but this can be overridden by specifying the
xminandxmaxparameters.xminandxmaxcan be either a single value or a sequence of values. If a single value is provided, it is applied to all lines. If a sequence is provided, the length ofxminandxmaxmust match the length ofy.The term “horizontal” lines can be interpreted differently in different coordinate systems:
Cartesian: lines are plotted as straight lines.
Polar: lines are plotted as arcs along a constant radius.
Geographic: lines are plotted as arcs along parallels (i.e., constant latitude).
- Parameters:
y (
float|Sequence[float]) – Y-coordinates to plot the lines. It can be a single value (for a single line) or a sequence of values (for multiple lines).xmin/xmax – X-coordinates of the start/end point(s) of the line(s). If
None, defaults to the X-limits of the current plot.xminandxmaxcan be either a single value or a sequence of values. If a single value is provided, it is applied to all lines. If a sequence is provided, the length ofxminandxmaxmust match the length ofy.pen (
str|None, default:None) – Pen attributes for the line(s), in the format of width,color,style.label (
str|None, default:None) – Label for the line(s), to be displayed in the legend.no_clip (
bool, default:False) – Do not clip lines outside the plot region. Only makes sense in the Cartesian coordinate system. [Default isFalseto clip lines at the plot region.]perspective (
str|bool|None, default:None) – Select perspective view and set the azimuth and elevation angle of the viewpoint. Refer topygmt.Figure.plotfor details.
Examples
>>> import pygmt
>>> fig = pygmt.Figure()
>>> fig.basemap(region=[0, 10, 0, 10], projection="X10c/10c", frame=True)
>>> fig.hlines(y=1, pen="1p,black", label="Line at y=1")
>>> fig.hlines(y=2, xmin=2, xmax=8, pen="1p,red,-", label="Line at y=2")
>>> fig.hlines(y=[3, 4], xmin=3, xmax=7, pen="1p,black,.", label="Lines at y=3,4")
>>> fig.hlines(y=[5, 6], xmin=4, xmax=9, pen="1p,red", label="Lines at y=5,6")
>>> fig.hlines(
...     y=[7, 8], xmin=[0, 1], xmax=[7, 8], pen="1p,blue", label="Lines at y=7,8"
... )
>>> fig.legend()
>>> fig.show()