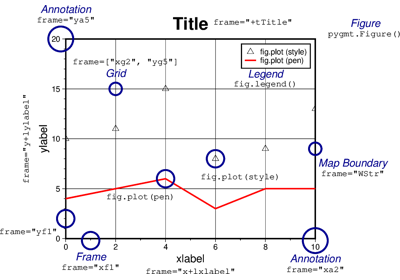
pygmt.Figure.text
- Figure.text(textfiles=None, x=None, y=None, position=None, text=None, angle=False, font=False, fill=None, pen=None, justify=None, offset=None, no_clip=False, projection=None, region=None, frame=False, verbose=False, panel=False, perspective=False, transparency=None, **kwargs)
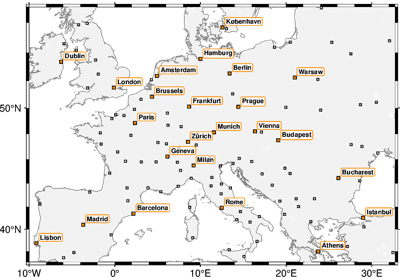
Plot or typeset text.
Must provide at least one of the following combinations as input:
textfilesx/y, andtextpositionandtext
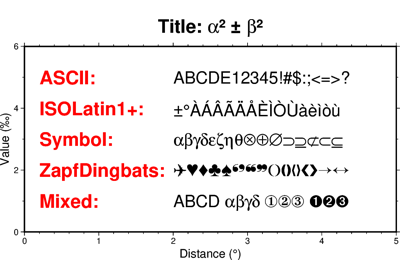
The text strings passed via the
textparameter can contain ASCII characters and non-ASCII characters defined in the Adobe ISOLatin1+, Adobe Symbol, Adobe ZapfDingbats and ISO-8859-x (x can be 1-11, 13-16) encodings. Refer to Supported Encodings and Non-ASCII Characters for the full list of supported non-ASCII characters.For typesetting one or more paragraphs of text, see
pygmt.Figure.paragraph.Full GMT docs at https://docs.generic-mapping-tools.org/6.6/text.html.
Aliases:
C = clearance
a = aspatial
e = find
f = coltypes
h = header
it = use_word
w = wrap
B = frame
D = offset
F = +a: angle, +c: position, +j: justify, +f: font
G = fill
J = projection
N = no_clip
R = region
V = verbose
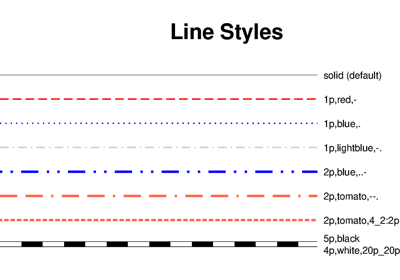
W = pen
c = panel
p = perspective
t = transparency
- Parameters:
A file name or a list of file names containing one or more records. Each record has the following columns:
x: X coordinate or longitude
y: Y coordinate or latitude
angle: Angle in degrees counter-clockwise from horizontal
font: Text size, font, and color
justify: 2-character justification code
text: The text string to typeset
The angle, font, and justify columns are optional and can be set by using the
angle,font, andjustifyparameters, respectively. If these parameters are set toTrue, then the corresponding columns must be present in the input file(s) and the columns must be in the order mentioned above.x/y (float or 1-D arrays) – The x and y coordinates, or an array of x and y coordinates to plot the text.
position (
Literal['TL','TC','TR','ML','MC','MR','BL','BC','BR'] |None, default:None) – Set reference point on the plot for the text by using x, y coordinates extracted fromregioninstead of providing them throughx/y. Specify with a 2-character justification code. For example,position="TL"plots the text at the Top Left corner of the plot.text (
str|Sequence[str] |ndarray|StringArray|None, default:None) – The text string, or an array of strings to plot on the figure.angle (
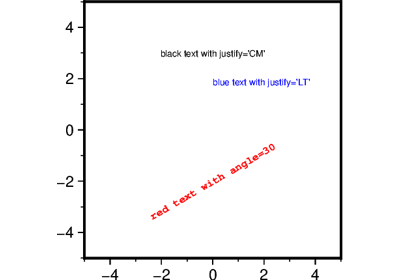
float|Sequence[float] |bool, default:False) – Set the angle measured in degrees counter-clockwise from horizontal (e.g. 30 sets the text at 30 degrees). If no angle is explicitly given (i.e.angle=True) then the input totextfilesmust have this as a column.font (
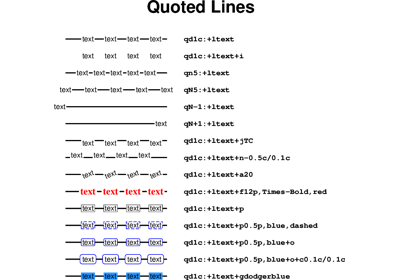
str|Sequence[str] |ndarray|StringArray|bool, default:False) – Set the font specification with format size,font,color where size is text size in points, font is the font to use, and color sets the font color. For example,font="12p,Helvetica-Bold,red"selects a 12p, red, Helvetica-Bold font. If no font info is explicitly given (i.e.font=True), then the input totextfilesmust have this information in one of its columns.justify (
bool|None|Literal['TL','TC','TR','ML','MC','MR','BL','BC','BR'] |Sequence[Literal['TL','TC','TR','ML','MC','MR','BL','BC','BR']], default:None) – Set the alignment which refers to the part of the text string that will be mapped onto the (x, y) point. Choose a 2-character justification code, e.g., BL for Bottom Left. If no justification is explicitly given (i.e.justify=True), then the input totextfilesmust have this as a column.clearance (str) – [dx/dy][+to|O|c|C]. Adjust the clearance between the text and the surrounding box [Default is 15% of the font size]. Only used if
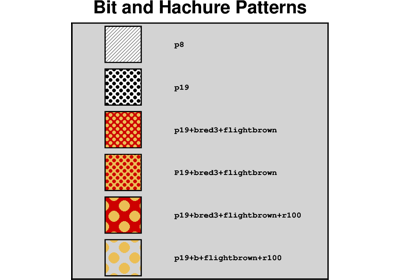
penorfillare specified. Append the unit you want (c for centimeters, i for inches, or p for points; if not given we consult PROJ_LENGTH_UNIT) or % for a percentage of the font size. Optionally, use modifier +t to set the shape of the text box when usingfilland/orpen. Append lowercase o to get a straight rectangle [Default is o]. Append uppercase O to get a rounded rectangle. In paragraph mode (paragraph) you can also append lowercase c to get a concave rectangle or append uppercase C to get a convex rectangle.fill (
str|None, default:None) – Set color for filling text boxes [Default is no fill].pen (
str|None, default:None) – Set the pen used to draw a rectangle around the text string (seeclearance) [Default is"0.25p,black,solid"].offset (
Sequence[float|str] |str|None, default:None) – (dx, dy) or [j|J]dx[/dy][+v[pen]]. Offset the text from the projected (x, y) point by (dx, dy) [Default is (0, 0)]. If dy is not specified then it is set equal to dx. Use j to offset the text away from the point instead (i.e., the text justification will determine the direction of the shift). Using J will shorten diagonal offsets at corners by sqrt(2). Optionally, append +v which will draw a line from the original point to the shifted point; append a pen to change the attributes for this line.no_clip (
bool, default:False) – Do not clip text at the frame boundaries [Default isFalse].projection (
str|None, default:None) – projcode[projparams/]width|scale. Select map projection.region (str or list) – xmin/xmax/ymin/ymax[+r][+uunit]. Specify the region of interest. Required if this is the first plot command.
verbose (bool or str) – Select verbosity level [Full usage].
aspatial (bool or str) – [col=]name[,…]. Control how aspatial data are handled during input and output. Full documentation is at https://docs.generic-mapping-tools.org/6.6/gmt.html#aspatial-full.
panel (
int|Sequence[int] |bool, default:False) –Select a specific subplot panel. Only allowed when used in
Figure.subplotmode.Trueto advance to the next panel in the selected order.index to specify the index of the desired panel.
(row, col) to specify the row and column of the desired panel.
The panel order is determined by the
Figure.subplotmethod. row, col and index all start at 0.find (str) – [~]“pattern” | [~]/regexp/[i]. Only pass records that match the given pattern or regular expressions [Default processes all records]. Prepend ~ to the pattern or regexp to instead only pass data expressions that do not match the pattern. Append i for case insensitive matching. This does not apply to headers or segment headers.
coltypes (str) – [i|o]colinfo. Specify data types of input and/or output columns (time or geographical data). Full documentation is at https://docs.generic-mapping-tools.org/6.6/gmt.html#f-full.
header (str) –
[i|o][n][+c][+d][+msegheader][+rremark][+ttitle]. Specify that input and/or output file(s) have n header records [Default is 0]. Prepend i if only the primary input should have header records. Prepend o to control the writing of header records, with the following modifiers supported:
+d to remove existing header records.
+c to add a header comment with column names to the output [Default is no column names].
+m to add a segment header segheader to the output after the header block [Default is no segment header].
+r to add a remark comment to the output [Default is no comment]. The remark string may contain \n to indicate line-breaks.
+t to add a title comment to the output [Default is no title]. The title string may contain \n to indicate line-breaks.
Blank lines and lines starting with # are always skipped.
use_word (int) – Select a specific word from the trailing text, with the first word being 0 [Default is the entire trailing text]. No numerical columns can be specified.
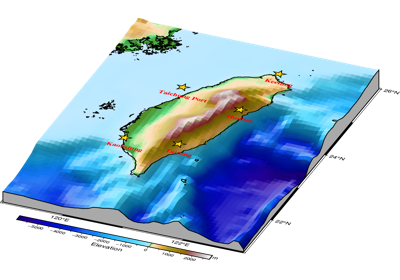
perspective (
float|Sequence[float] |str|bool, default:False) –Select perspective view and set the azimuth and elevation of the viewpoint.
Accepts a single value or a sequence of two or three values: azimuth, (azimuth, elevation), or (azimuth, elevation, zlevel).
azimuth: Azimuth angle of the viewpoint in degrees [Default is 180, i.e., looking from south to north].
elevation: Elevation angle of the viewpoint above the horizon [Default is 90, i.e., looking straight down at nadir].
zlevel: Z-level at which 2-D elements (e.g., the plot frame) are drawn. Only applied when used together with
zsizeorzscale. [Default is at the bottom of the z-axis].
Alternatively, set
perspective=Trueto reuse the perspective setting from the previous plotting method, or pass a string following the full GMT syntax for finer control (e.g., adding+wor+vmodifiers to select an axis location other than the plot origin). See https://docs.generic-mapping-tools.org/6.6/gmt.html#perspective-full for details.transparency (float) – Set transparency level, in [0-100] percent range [Default is
0, i.e., opaque]. Only visible when PDF or raster format output is selected. Only the PNG format selection adds a transparency layer in the image (for further processing).transparencycan also be a 1-D array to set varying transparency for texts, but this option is only valid if usingx/yandtext.wrap (str) –
y|a|w|d|h|m|s|cperiod[/phase][+ccol]. Convert the input x-coordinate to a cyclical coordinate, or a different column if selected via +ccol. The following cyclical coordinate transformations are supported:
y: yearly cycle (normalized)
a: annual cycle (monthly)
w: weekly cycle (day)
d: daily cycle (hour)
h: hourly cycle (minute)
m: minute cycle (second)
s: second cycle (second)
c: custom cycle (normalized)
Full documentation is at https://docs.generic-mapping-tools.org/6.6/gmt.html#w-full.
See also
pygmt.Figure.paragraphTypeset one or multiple paragraphs.
Examples using pygmt.Figure.text


GeoPandas: Plotting points with Point or MultiPoint geometry