Note
Go to the end to download the full example code.
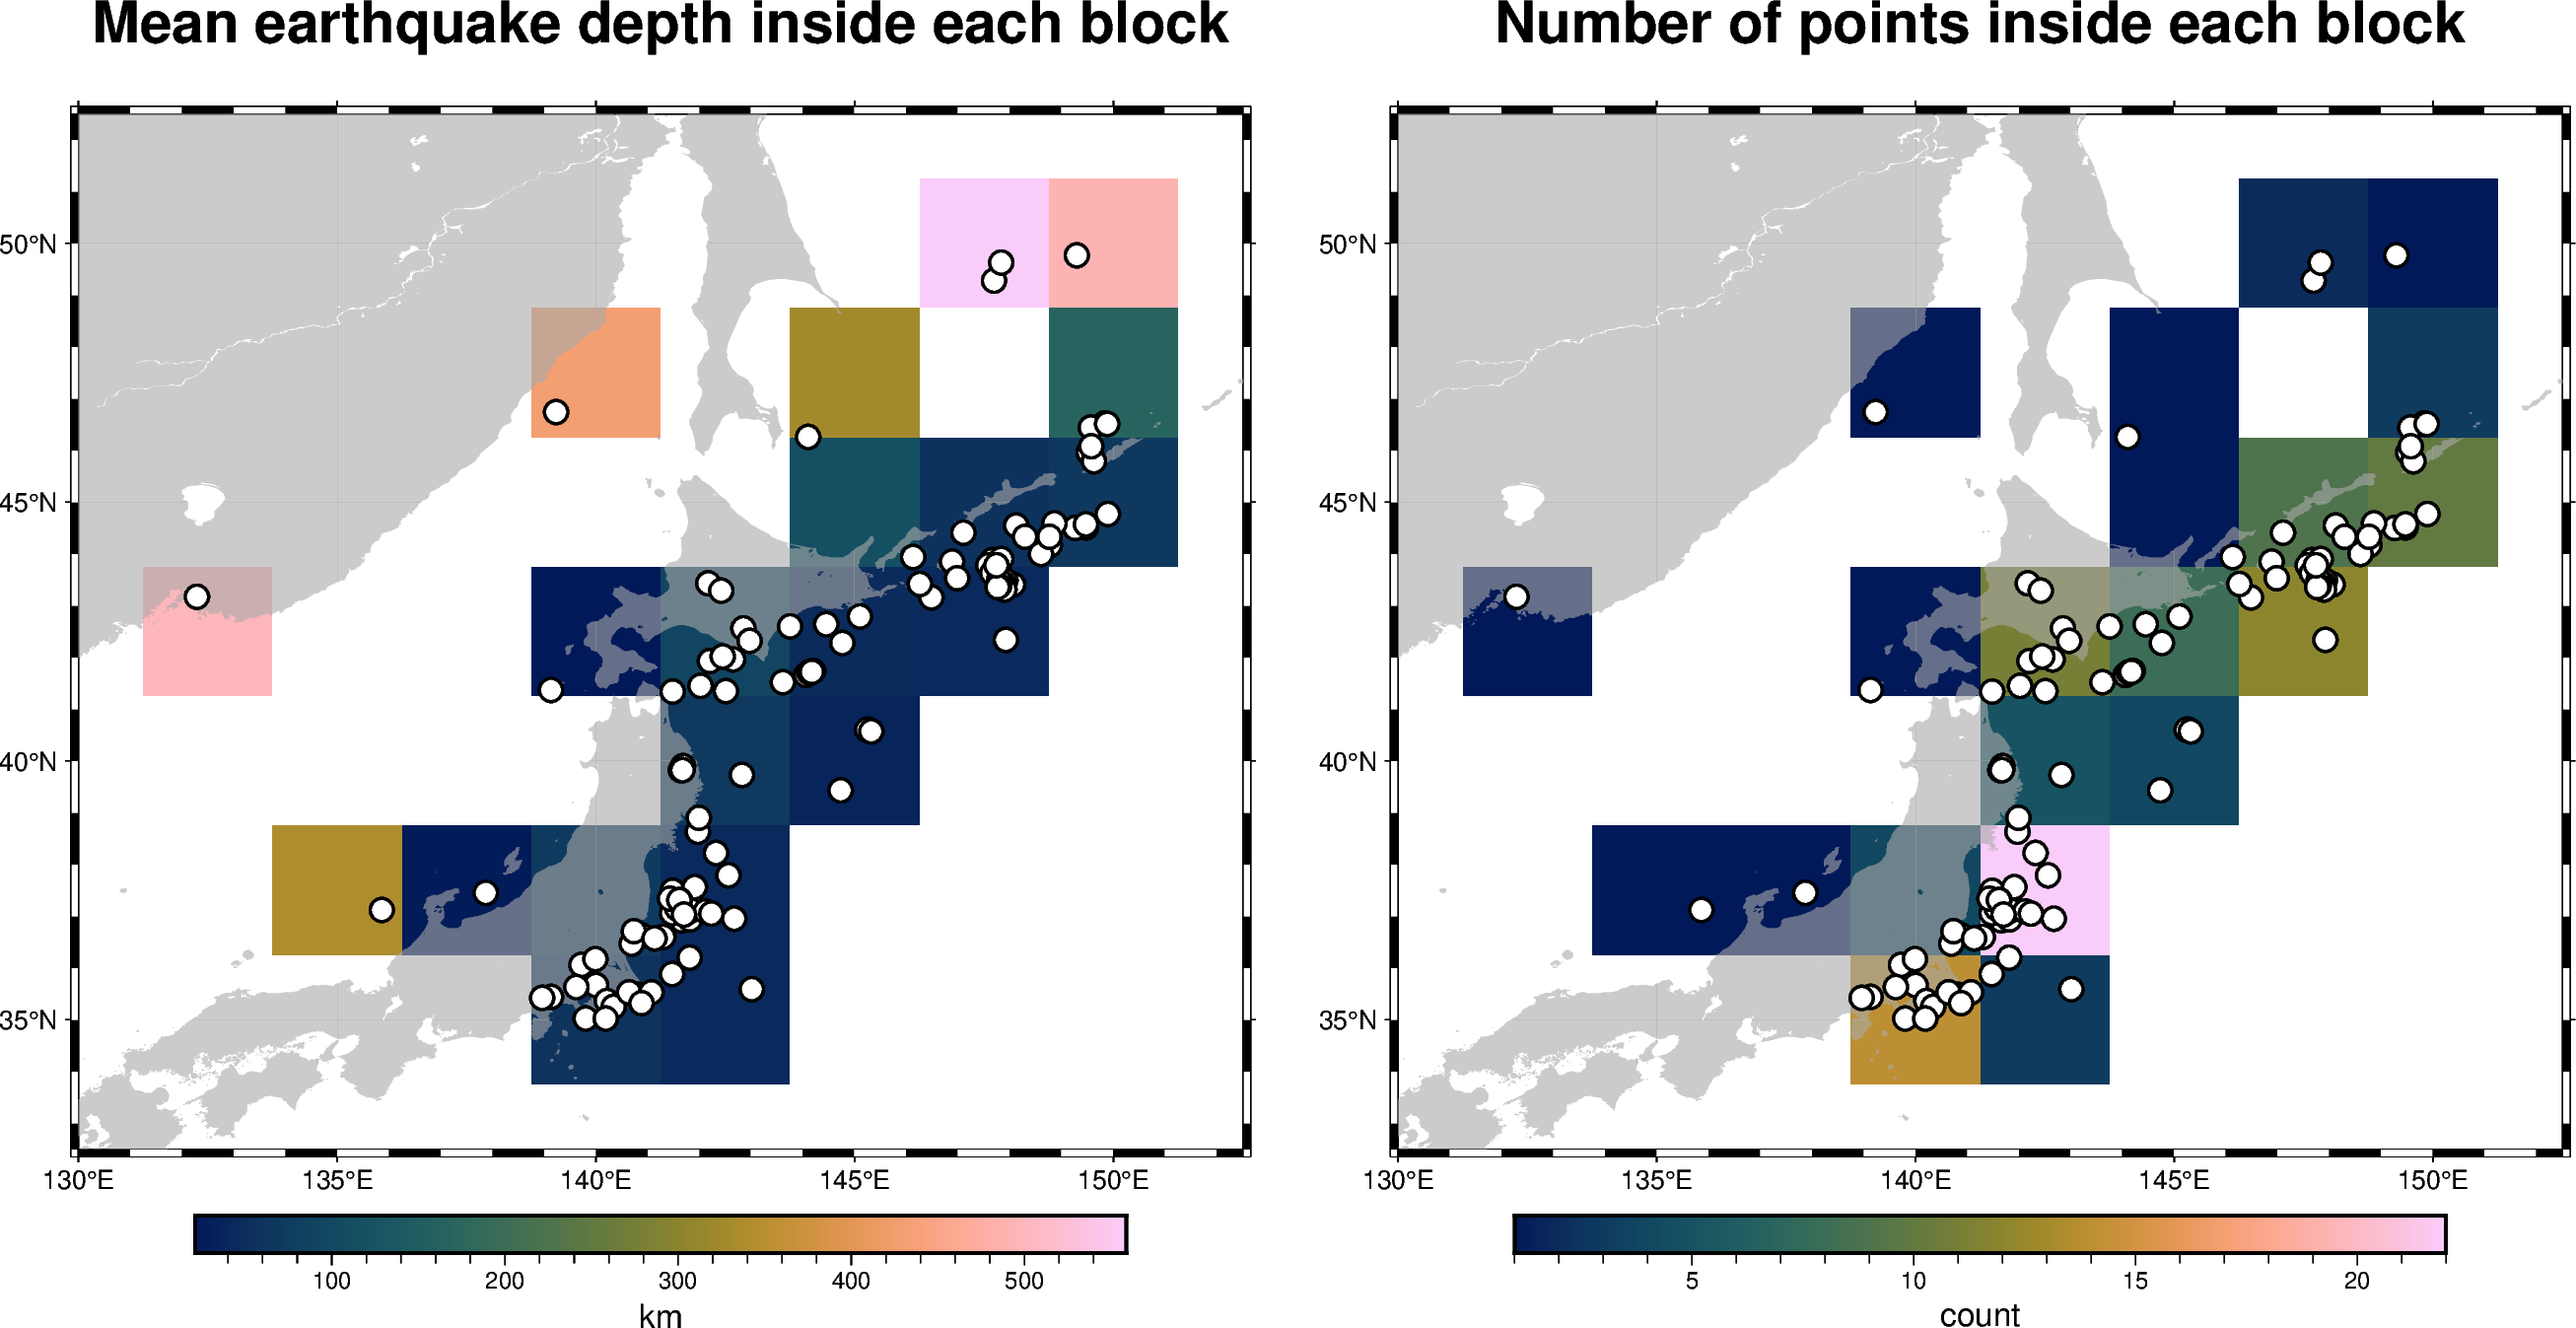
Blockmean
The pygmt.blockmean function calculates different quantities
inside blocks/bins whose dimensions are defined via the spacing parameter.
The following examples show how to calculate the averages of the given values
inside each bin and how to report the number of points inside each bin.
import pygmt
from pygmt.params import Axis, Frame

# Load sample data
data = pygmt.datasets.load_sample_data(name="japan_quakes")
# Select only needed columns
data = data[["longitude", "latitude", "depth_km"]]

# Set the region for the plot
region = [130, 152.5, 32.5, 52.5]
# Define spacing in x- and y-directions (150x150 arc-minute blocks)
spacing = "150m"

fig = pygmt.Figure()

# Calculate mean depth in kilometers from all events within
# 150x150 arc-minute bins using blockmean
df = pygmt.blockmean(data=data, region=region, spacing=spacing)
# Convert to grid
grd = pygmt.xyz2grd(data=df, region=region, spacing=spacing)

fig.basemap(
    region=region,
    projection="M11c",
    frame=Frame(
        axis=Axis(annot=True, tick=True),
        title="Mean earthquake depth inside each block",
    ),
)
fig.grdimage(grid=grd, cmap="SCM/batlow")
# Plot slightly transparent landmasses on top
fig.coast(land="darkgray", transparency=40)
# Plot original data points
fig.plot(x=data.longitude, y=data.latitude, style="c0.3c", fill="white", pen="1p,black")
fig.colorbar(label="km")

fig.shift_origin(xshift="w+5c")

# Calculate number of total locations within 150x150 arc-minute bins
# with blockmean's summary parameter
df = pygmt.blockmean(data=data, region=region, spacing=spacing, summary="n")
grd = pygmt.xyz2grd(data=df, region=region, spacing=spacing)

fig.basemap(
    region=region,
    projection="M11c",
    frame=Frame(
        axis=Axis(annot=True, tick=True), title="Number of points inside each block"
    ),
)
fig.grdimage(grid=grd, cmap="SCM/batlow")
fig.coast(land="darkgray", transparency=40)
fig.plot(x=data.longitude, y=data.latitude, style="c0.3c", fill="white", pen="1p,black")
fig.colorbar(label="Count")

fig.show()
Total running time of the script: (0 minutes 0.515 seconds)