Note
Go to the end to download the full example code.
Points
The pygmt.Figure.plot method can plot data points. The symbol and
size are set with the style parameter.
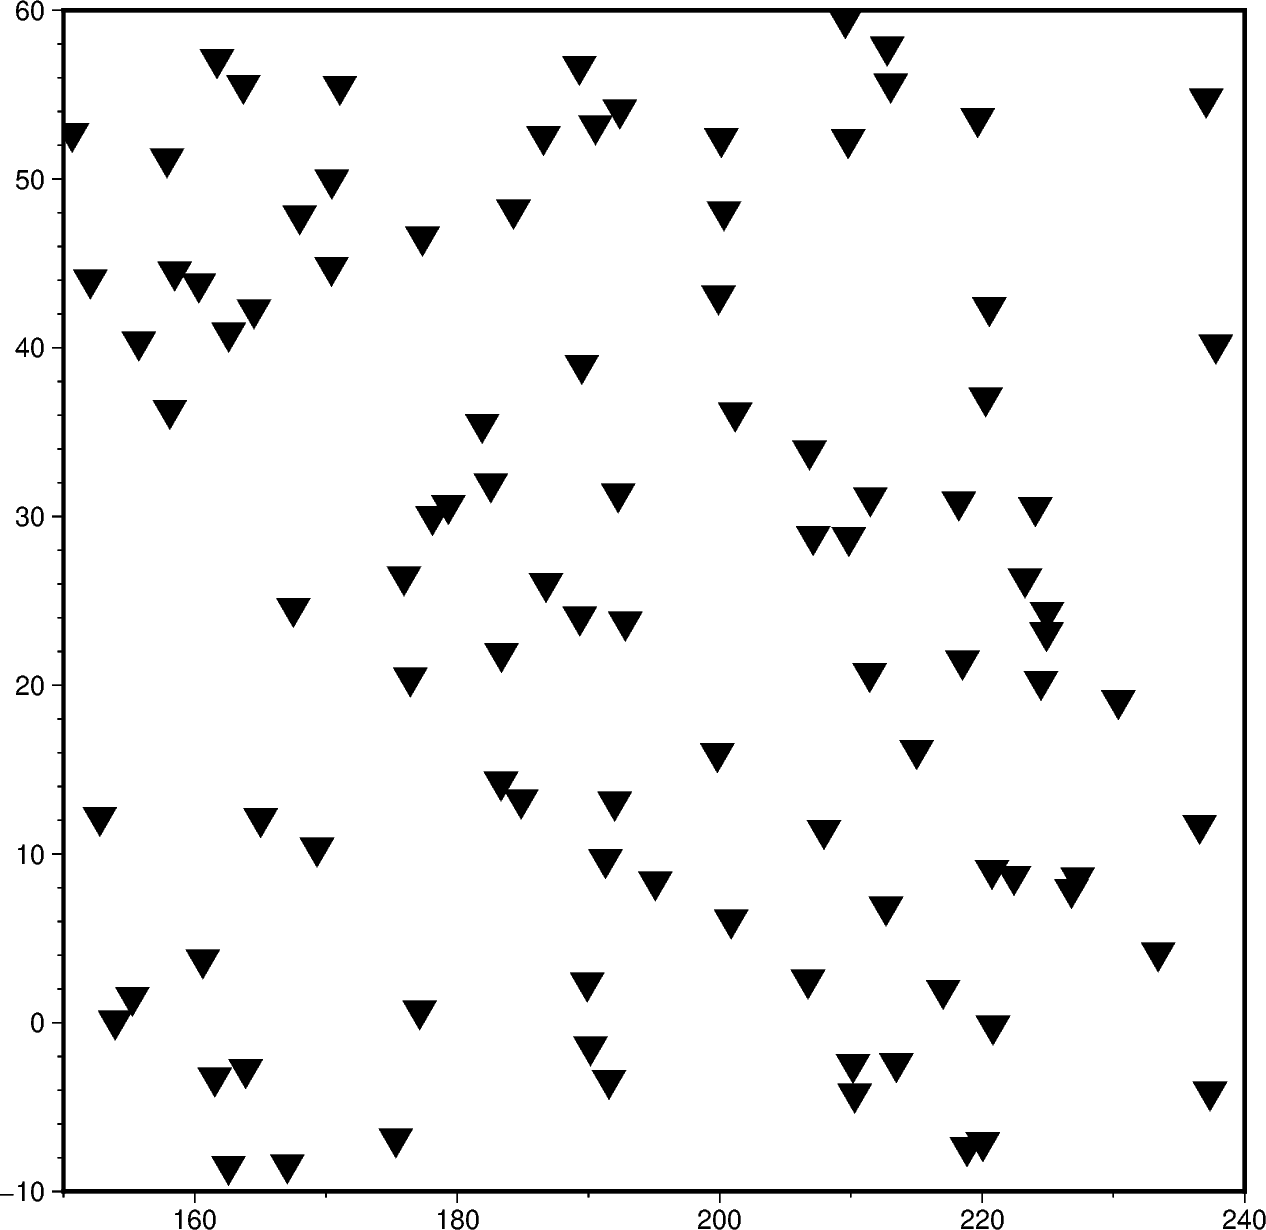
import numpy as np
import pygmt

# Generate a random set of points to plot
rng = np.random.default_rng(seed=42)
region = [150, 240, -10, 60]
x = rng.uniform(low=region[0], high=region[1], size=100)
y = rng.uniform(low=region[2], high=region[3], size=100)


fig = pygmt.Figure()
# Create a 15 cm x 15 cm basemap with a Cartesian projection (X) using the
# data region
fig.basemap(region=region, projection="X15c", frame=True)
# Plot using inverted triangles (i) of 0.5 cm size
fig.plot(x=x, y=y, style="i0.5c", fill="black")
fig.show()
Total running time of the script: (0 minutes 0.163 seconds)