Note
Go to the end to download the full example code.
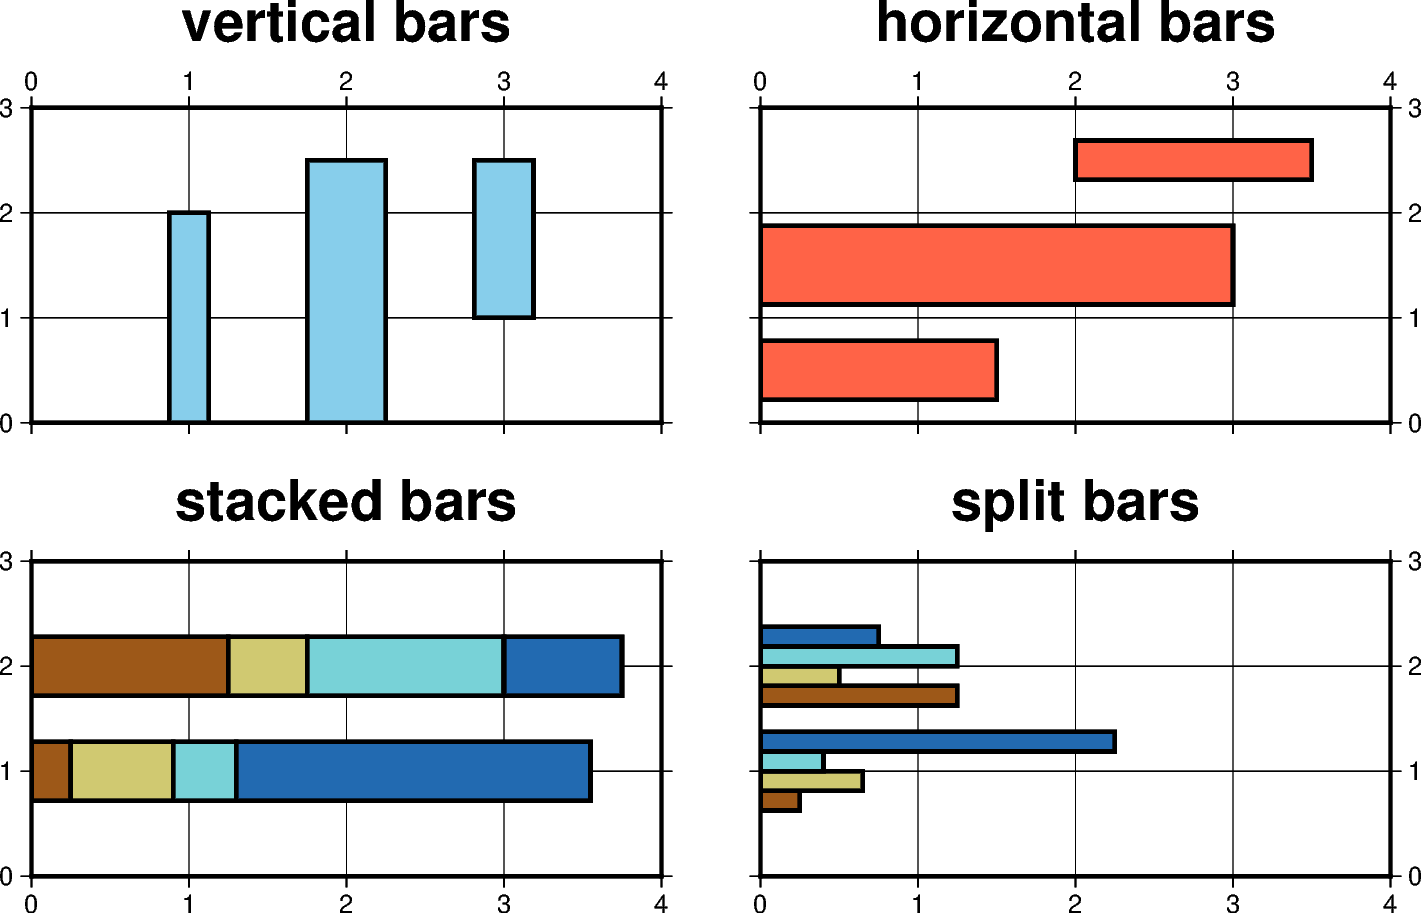
Vertical or horizontal bars
The pygmt.Figure.plot method can plot vertical (b) or
horizontal (B) bars by passing the corresponding shortcut to
the style parameter. By default, base = 0 meaning that the
bar is starting from 0. Append +b[base] to change this
value. To plot multi-band bars, please append
+v|iny (for vertical bars) or +v|inx
(for horizontal ones), where ny or nx indicate the total
number of bands in the bar (and hence the number of values required
to follow the x,y coordinate pair in the input). Here, +i
means we must accumulate the bar values from the increments
dy or dx, while +v means we get the complete values relative
to base. Normally, the bands are plotted as sections of a final
single bar. Use +s to instead split the bar into ny or nx
side-by-side, individual and thinner bars. Multi-band bars require
cmap=True with one color per band.
import pygmt
from pygmt.params import Axis, Frame

fig = pygmt.Figure()

pygmt.makecpt(cmap="SCM/roma", series=[0, 4, 1])

with fig.subplot(
    nrows=2,
    ncols=2,
    subsize=("8c", "4c"),
    frame=Axis(annot=True, grid=True),
    sharey=True,
    sharex=True,
    margins=["0.5c", "0.75c"],
):
    pen = "1.5p"
    with fig.set_panel(panel=0):
        fill = "skyblue"
        fig.basemap(region=[0, 4, 0, 3], frame=Frame(title="vertical bars"))
        fig.plot(x=1, y=2, style="b0.5c", fill=fill, pen=pen)
        fig.plot(x=2, y=2.5, style="b1c", fill=fill, pen=pen)
        # +b1 means that the bar is starting from y=1 here
        fig.plot(x=3, y=2.5, style="b0.75c+b1", fill=fill, pen=pen)

    with fig.set_panel(panel=1):
        fill = "tomato"
        fig.basemap(region=[0, 4, 0, 3], frame=Frame(title="horizontal bars"))
        fig.plot(x=1.5, y=0.5, style="B0.75c", fill=fill, pen=pen)
        fig.plot(x=3, y=1.5, style="B1c", fill=fill, pen=pen)
        # +b2 means that the bar is starting from x=2 here
        fig.plot(x=3.5, y=2.5, style="B0.5c+b2", fill=fill, pen=pen)

    # generate dictionary for plotting multi-band bars
    data = {
        "x1": [0.25, 1.25],
        "y": [1, 2],
        "x2": [0.65, 0.5],
        "x3": [0.4, 1.25],
        "x4": [2.25, 0.75],
    }

    with fig.set_panel(panel=2):
        fig.basemap(region=[0, 4, 0, 3], frame=Frame(title="stacked bars"))
        fig.plot(data=data, style="B0.75c+i4", cmap=True, pen=pen)

    with fig.set_panel(panel=3):
        fig.basemap(region=[0, 4, 0, 3], frame=Frame(title="split bars"))
        fig.plot(data=data, style="B1c+v4+s", cmap=True, pen=pen)

fig.show()
Total running time of the script: (0 minutes 0.223 seconds)