Note
Go to the end to download the full example code.
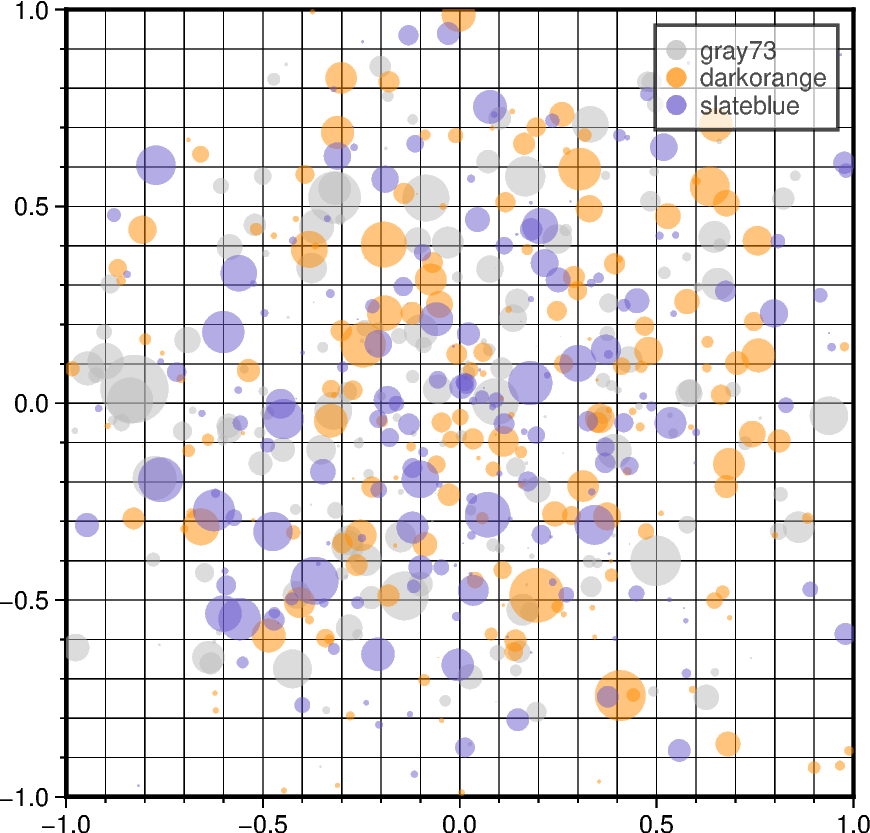
Scatter plots with a legend
To create a scatter plot with a legend one may use a loop and create one scatter plot per item to appear in the legend and set the label accordingly.
Modified from the matplotlib example: https://matplotlib.org/stable/gallery/lines_bars_and_markers/scatter_with_legend.html
import numpy as np
import pygmt
from pygmt.params import Axis, Frame

rng = np.random.default_rng(seed=19680801)
n = 200  # number of random data points

fig = pygmt.Figure()
fig.basemap(
    region=[-1, 1, -1, 1],
    projection="X10c/10c",
    frame=Frame(
        axes="WSrt",
        xaxis=Axis(annot=0.5, tick=True, grid=True),
        yaxis=Axis(annot=0.5, tick=True, grid=True),
    ),
)
for fill in ["gray73", "darkorange", "slateblue"]:
    # Generate standard normal distributions centered on 0
    # with standard deviations of 1
    x = rng.normal(loc=0, scale=0.5, size=n)  # random x data
    y = rng.normal(loc=0, scale=0.5, size=n)  # random y data
    size = rng.normal(loc=0, scale=0.5, size=n) * 0.5  # random size, in cm

    # plot data points as circles (style="c"), with different sizes
    fig.plot(
        x=x,
        y=y,
        style="c",
        size=size,
        fill=fill,
        # Set the legend label,
        # and set the symbol size to be 0.25 cm (+S0.25c) in legend
        label=f"{fill}+S0.25c",
        transparency=50,  # set transparency level for all symbols
    )

fig.legend(transparency=30)  # set transparency level for legends
fig.show()
Total running time of the script: (0 minutes 0.241 seconds)