pygmt.params.Frame
- class pygmt.params.Frame(axes=None, title=None, subtitle=None, fill=None, axis=None, axis2=None, xaxis=None, yaxis=None, zaxis=None, xaxis2=None, yaxis2=None, zaxis2=None)[source]
Class for setting up the frame and axes of a plot.
Examples
To draw the west and south axes with both ticks and annotations, and draw the east and north axes with ticks but without annotations:
>>> import pygmt
>>> from pygmt.params import Axis, Frame
>>> fig = pygmt.Figure()
>>> fig.basemap(
...     region=[0, 10, 0, 20], projection="X10c/10c", frame=Frame(axes="WSen")
... )
>>> fig.show()
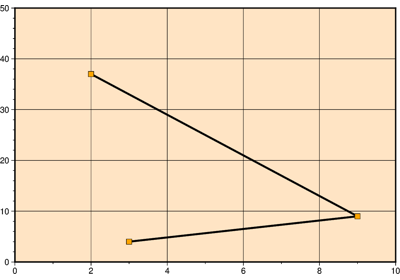
To draw the west and south axes with both ticks and annotations, and draw the east and north axes without ticks and annotations. For west and south axes, specify the same attributes for both axes using the
axisparameter, with intervals of 4 for annotations, 2 for ticks, and 1 for gridlines.>>> fig = pygmt.Figure() >>> fig.basemap( ... region=[0, 10, 0, 20], ... projection="X10c/10c", ... frame=Frame(axes="WSrt", axis=Axis(annot=4, tick=2, grid=1)), ... ) >>> fig.show()
To specify the attributes for x- and y-axes separately:
>>> fig = pygmt.Figure()
>>> fig.basemap(
...     region=[0, 10, 0, 20],
...     projection="X10c/10c",
...     frame=Frame(
...         axes="WSrt",
...         xaxis=Axis(annot=4, tick=2, grid=1, label="X Label"),
...         yaxis=Axis(annot=5, tick=2.5, grid=1, label="Y Label"),
...     ),
... )
>>> fig.show()
-
axes:
str|None= None Controls which axes are drawn and whether they are annotated, using a combination of the codes below. Axis omitted from the set will not be drawn.
For a 2-D plot, there are four axes: west, east, south, and north (or left, right, bottom, top if you prefer); For a 3-D plot, there is an extra Z-axis. They can be denoted by the following codes:
W (west), E (east), S (south), N (north), Z: Draw axes with both ticks and annotations.
w (west), e (east), s (south), n (north), z: Draw axes with ticks but without annotations.
l (left), r (right), b (bottom), t (top), u (up): Draw axes without ticks or annotations.
For examples:
"WS": Draw the west and south axes with both ticks and annotations, but do not draw the east and north axes."WSen": Draw the west and south axes with both ticks and annotations, draw the east and north axes with ticks but without annotations."WSrt": Draw the west and south axes with both ticks and annotations, draw the east and north axes without ticks or annotations."WSrtZ": Draw the west and south axes with both ticks and annotations, draw the east and north axes without ticks or annotations, and draw the z-axis with both ticks and annotations.
For a 3-D plot, if the z-axis code is specified, a single vertical axis will be drawn at the most suitable corner by default. Append any combination of the corner IDs from 1 to 4 to draw one or more vertical axes at the corresponding corners (e.g.,
"WSrtZ1234"):1: the south-western (lower-left) corner
2: the south-eastern (lower-right) corner
3: the north-eastern (upper-right) corner
4: the north-western (upper-left) corner
-
subtitle:
str|None= None The subtitle string centered below the plot title. Requires
titleto be set. [Default is no subtitle].
-
fill:
str|None= None Fill for the interior of the frame with a color or a pattern [Default is no fill].
-
axis:
Axis|None= None Specify the attributes for axes by an
Axisobject.The attributes for x and y axes can be specified in two ways: (1) specifying the same attributes for both axes using the
axisparameter; (2) specifying the attributes for each axis separately using thexaxisandyaxisparameters. The attributes for z-axis can only be specified separately using thezaxisparameter.GMT uses the notion of primary (the default) and secondary axes, while secondary axes are optional and mostly used for time axes annotations. To specify the same attributes for both secondary x and y axes, use the
axis2parameter. To specify the attributes for the secondary axes separately, use thexaxis2,yaxis2, andzaxis2parameters.
-
axes:
Examples using pygmt.params.Frame

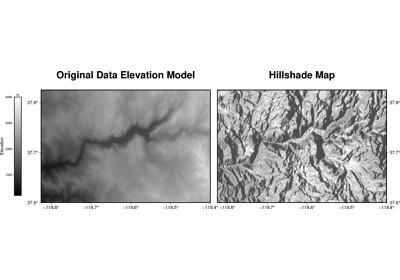
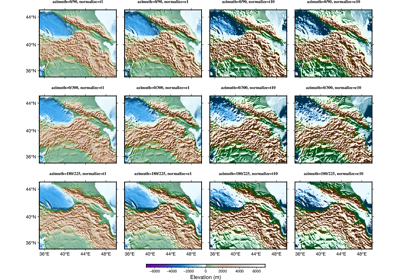
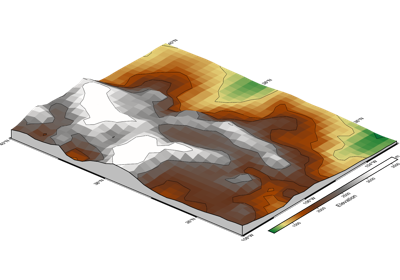
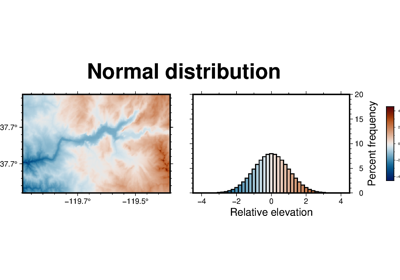
Calculating grid gradient with custom azimuth and normalization parameters