Note
Go to the end to download the full example code.
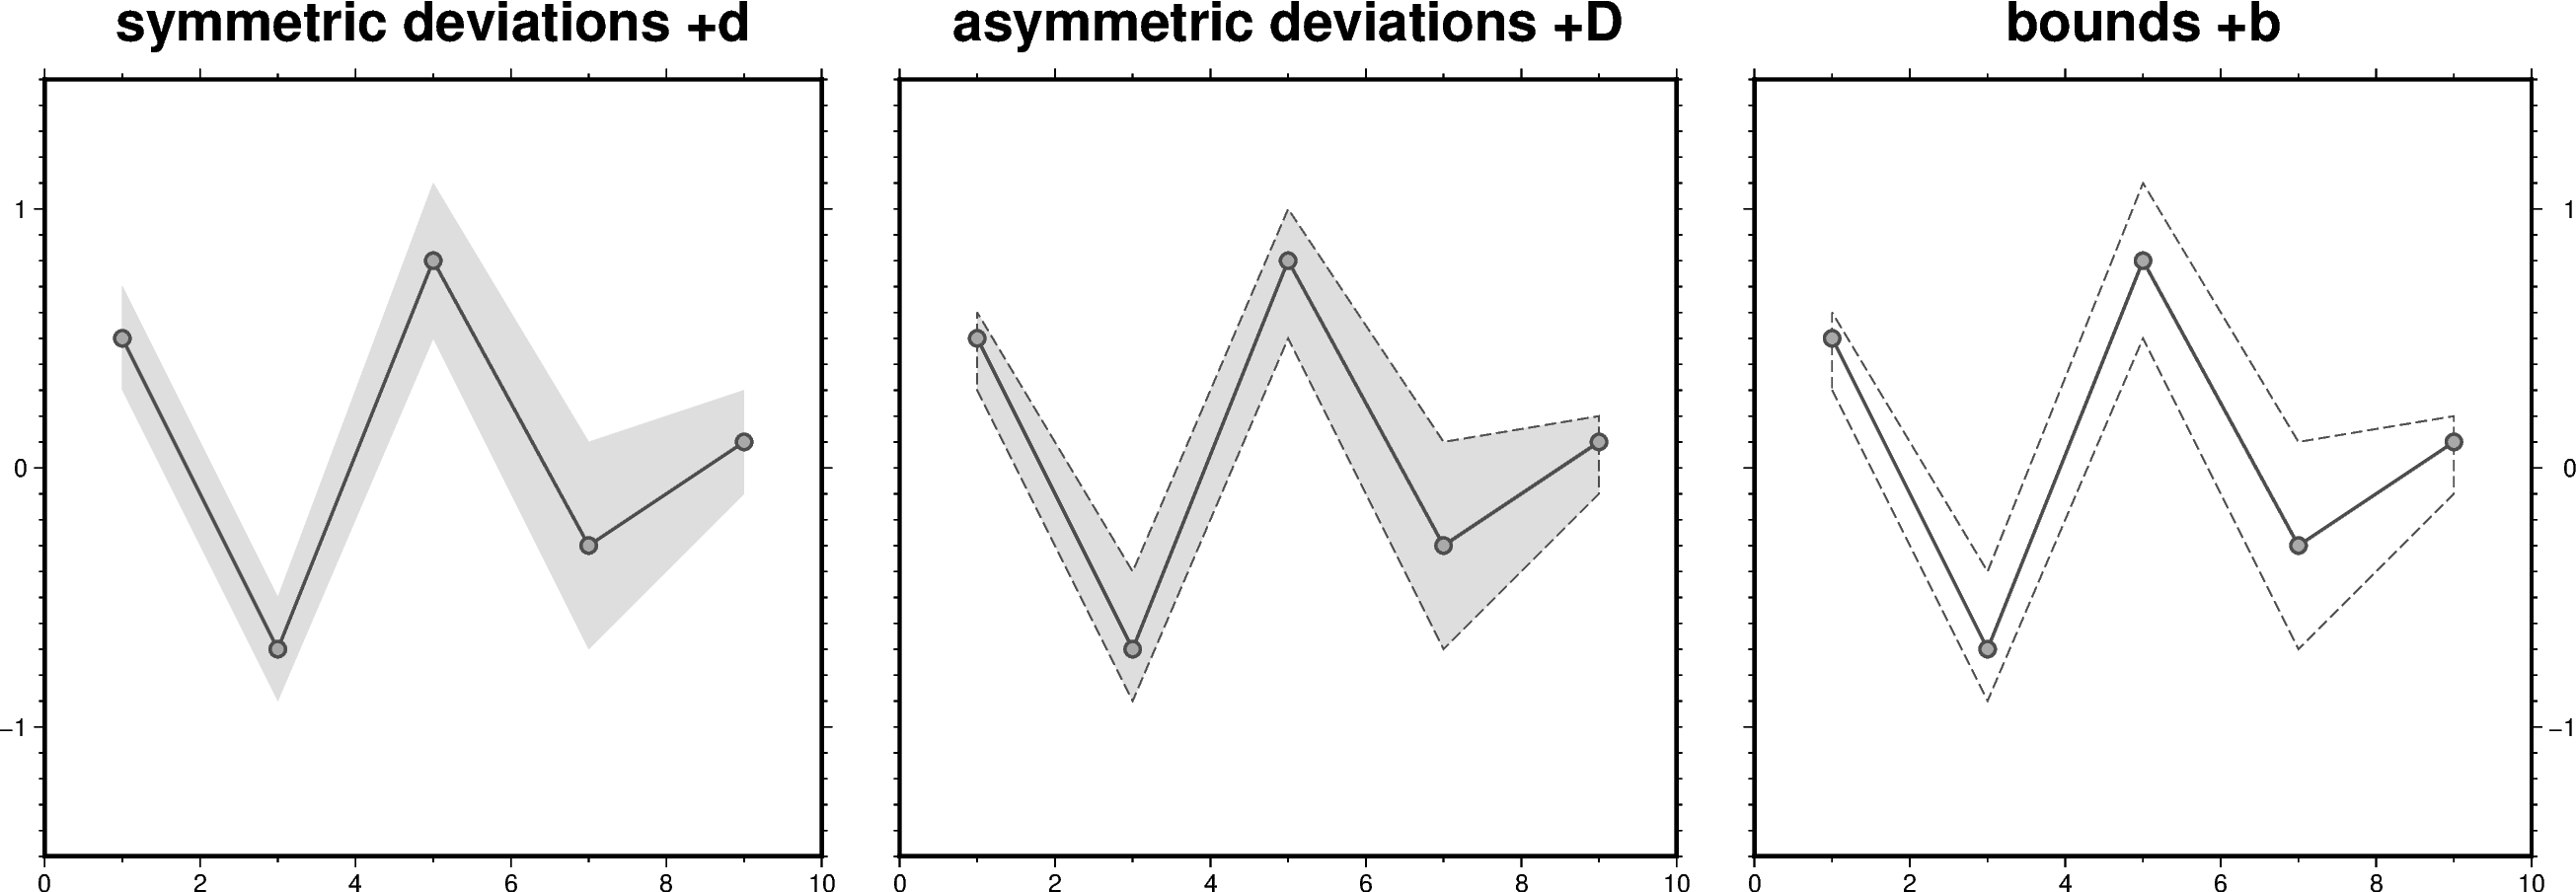
Envelope
The close parameter of the pygmt.Figure.plot method can be used to build a
symmetrical or an asymmetrical envelope. The user can give either the deviations or the
bounds in y-direction. For the first case append "+d" or "+D" and for the latter
case "+b".
import pandas as pd
import pygmt
from pygmt.params import Axis, Frame

# Define a pandas.DataFrame with columns for x and y as well as the lower and upper
# deviations
df_devi = pd.DataFrame(
    data={
        "x": [1, 3, 5, 7, 9],
        "y": [0.5, -0.7, 0.8, -0.3, 0.1],
        "y_deviation_low": [0.2, 0.2, 0.3, 0.4, 0.2],
        "y_deviation_upp": [0.1, 0.3, 0.2, 0.4, 0.1],
    }
)

# Define the same pandas.DataFrame but with lower and upper bounds
df_bound = pd.DataFrame(
    data={
        "x": [1, 3, 5, 7, 9],
        "y": [0.5, -0.7, 0.8, -0.3, 0.1],
        "y_bound_low": [0.3, -0.9, 0.5, -0.7, -0.1],
        "y_bound_upp": [0.6, -0.4, 1.1, 0.1, 0.2],
    }
)


fig = pygmt.Figure()

# -----------------------------------------------------------------------------
# Left
fig.basemap(
    region=[0, 10, -1.5, 1.5],
    projection="X10c",
    frame=Frame(
        axes="WSne",
        title="symmetric deviations +d",
        xaxis=Axis(annot=2, tick=1),
        yaxis=Axis(annot=1, tick=0.1),
    ),
)

# Plot a symmetrical envelope based on the deviations ("+d")
fig.plot(
    data=df_devi,
    close="+d",
    # Fill the envelope in gray color with a transparency of 50 %
    fill="gray@50",
    pen="1p,gray30",
)

# Plot the data points on top
fig.plot(data=df_devi, style="c0.2c", pen="1p,gray30", fill="darkgray")

# Shift plot origin by the figure width ("w") plus 1 centimeter in x-direction
fig.shift_origin(xshift="w+1c")

# -----------------------------------------------------------------------------
# Middle
fig.basemap(
    region=[0, 10, -1.5, 1.5],
    projection="X10c",
    frame=Frame(
        axes="WSne",
        title="asymmetric deviations +D",
        xaxis=Axis(annot=2, tick=1),
        yaxis=Axis(tick=0.1),
    ),
)

# Plot an asymmetrical envelope based on the deviations ("+D")
fig.plot(
    data=df_devi,
    fill="gray@50",
    # Add an outline around the envelope. Here, a dashed pen ("+p") with 0.5-points
    # thickness and "gray30" color is used
    close="+D+p0.5p,gray30,dashed",
    pen="1p,gray30",
)

fig.plot(data=df_devi, style="c0.2c", pen="1p,gray30", fill="darkgray")

fig.shift_origin(xshift="w+1c")

# -----------------------------------------------------------------------------
# Right
fig.basemap(
    region=[0, 10, -1.5, 1.5],
    projection="X10c",
    # Use "\\053" to handle "+b" as a string not as a modifier
    frame=Frame(
        axes="wSnE",
        title="bounds \\053b",
        xaxis=Axis(annot=2, tick=1),
        yaxis=Axis(annot=1, tick=0.1),
    ),
)

# Plot an envelope based on the bounds ("+b")
fig.plot(data=df_bound, close="+b+p0.5p,gray30,dashed", pen="1p,gray30")

fig.plot(data=df_bound, style="c0.2c", pen="1p,gray30", fill="darkgray")

fig.show()
Total running time of the script: (0 minutes 0.315 seconds)