Note
Go to the end to download the full example code.
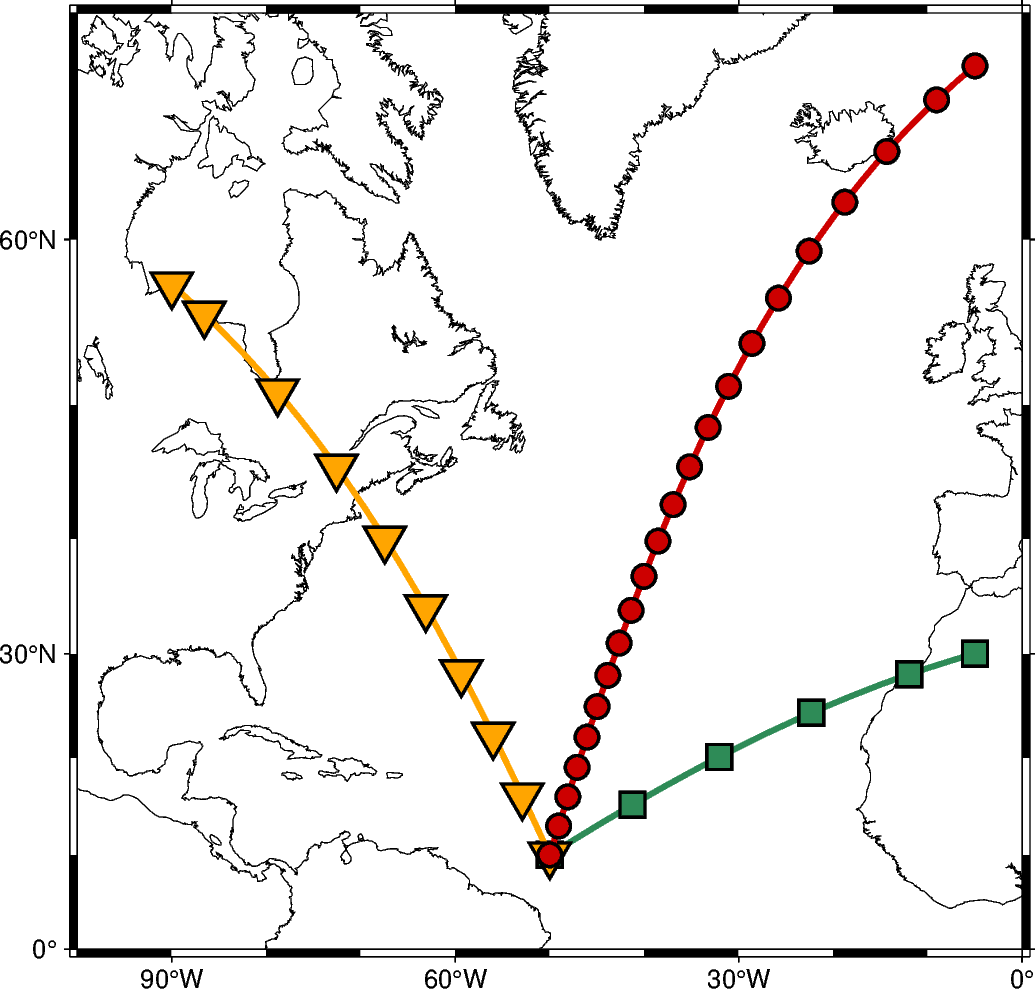
Generate points along great circles
The pygmt.project function can generate points along a great circle
whose center and end points can be defined via the center and endpoint
parameters, respectively. Using the generate parameter allows to generate
(r, s, p) points every dist units of p along a profile as
output. By default, all units (r, s and p) are set to degrees while
unit=True allows to set the unit for p to km.
import pygmt

fig = pygmt.Figure()

# generate points every 10 degrees along a great circle from 10N,50W to 30N,5W
points1 = pygmt.project(center=[-50, 10], endpoint=[-5, 30], generate=10)
# generate points every 750 km along a great circle from 10N,50W to 57.5N,90W
points2 = pygmt.project(center=[-50, 10], endpoint=[-90, 57.5], generate=750, unit=True)
# generate points every 350 km along a great circle from 10N,50W to 68N,5W
points3 = pygmt.project(center=[-50, 10], endpoint=[-5, 68], generate=350, unit=True)

# create a plot with coast and Mercator projection (M)
fig.basemap(region=[-100, 0, 0, 70], projection="M12c", frame=True)
fig.coast(shorelines=True, area_thresh=5000)

# plot individual points of first great circle as seagreen line
fig.plot(x=points1.r, y=points1.s, pen="2p,seagreen")
# plot individual points as seagreen squares atop
fig.plot(x=points1.r, y=points1.s, style="s.45c", fill="seagreen", pen="1p")

# plot individual points of second great circle as orange line
fig.plot(x=points2.r, y=points2.s, pen="2p,orange")
# plot individual points as orange inverted triangles atop
fig.plot(x=points2.r, y=points2.s, style="i.6c", fill="orange", pen="1p")

# plot individual points of third great circle as red3 line
fig.plot(x=points3.r, y=points3.s, pen="2p,red3")
# plot individual points as red3 circles atop
fig.plot(x=points3.r, y=points3.s, style="c.3c", fill="red3", pen="1p")

fig.show()
Total running time of the script: (0 minutes 0.215 seconds)