Note
Go to the end to download the full example code.
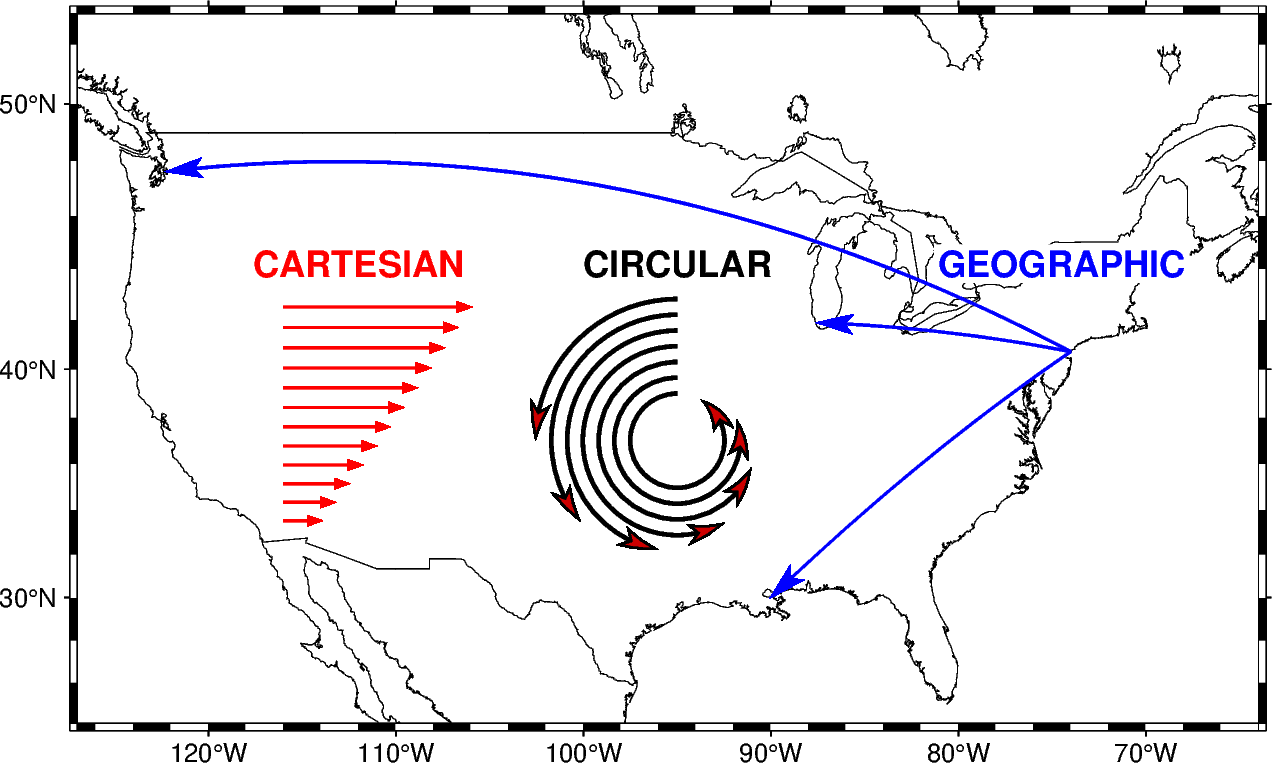
Cartesian, circular, and geographic vectors
The pygmt.Figure.plot method can plot Cartesian, circular, and geographic
vectors. The style parameter controls vector attributes. See also the
Vector attributes example.
import numpy as np
import pygmt

# Create a plot with coast, Mercator projection (M) over the continental US
fig = pygmt.Figure()
fig.coast(
    region=[-127, -64, 24, 53],
    projection="M15c",
    frame=True,
    borders=1,
    area_thresh=4000,
    shorelines="0.25p,black",
)


# Left: plot 12 Cartesian vectors with different lengths
x = np.linspace(-116, -116, 12)  # x-vector coordinates
y = np.linspace(33.5, 42.5, 12)  # y-vector coordinates
direction = np.zeros(x.shape)  # direction of vectors
length = np.linspace(0.5, 2.4, 12)  # length of vectors
# Cartesian vectors (v) with red fill and pen (+g, +p), vector head at the end (+e), and
# 40 degree angle (+a) with no indentation for the vector head (+h)
style = "v0.2c+e+a40+gred+h0+p1p,red"
fig.plot(x=x, y=y, style=style, pen="1p,red", direction=[direction, length])
fig.text(text="CARTESIAN", x=-112, y=44.2, font="13p,Helvetica-Bold,red", fill="white")


# Middle: plot 7 math angle arcs with different radii
num = 7
x = np.full(num, -95)  # x-coordinates of the center
y = np.full(num, 37)  # y-coordinates of the center
radius = 1.8 - 0.2 * np.arange(0, num)  # radius
startdir = np.full(num, 90)  # start direction in degrees
stopdir = 180 + 40 * np.arange(0, num)  # stop direction in degrees
# data for circular vectors
data = np.column_stack([x, y, radius, startdir, stopdir])
arcstyle = "m0.5c+ea"  # Circular vector (m) with an arrow at the end
fig.plot(data=data, style=arcstyle, fill="red3", pen="1.5p,black")
fig.text(text="CIRCULAR", x=-95, y=44.2, font="13p,Helvetica-Bold,black", fill="white")


# Right: plot geographic vectors using endpoints
NYC = [-74.0060, 40.7128]
CHI = [-87.6298, 41.8781]
SEA = [-122.3321, 47.6062]
NO = [-90.0715, 29.9511]
# '=' means geographic vectors. With the modifier '+s', the input data should contain
# coordinates of start and end points
style = "=0.5c+s+e+a30+gblue+h0.5+p1p,blue"
data = np.array([NYC + CHI, NYC + SEA, NYC + NO])
fig.plot(data=data, style=style, pen="1.0p,blue")
fig.text(
    text="GEOGRAPHIC", x=-74.5, y=44.2, font="13p,Helvetica-Bold,blue", fill="white"
)
fig.show()
Total running time of the script: (0 minutes 0.295 seconds)