Note
Go to the end to download the full example code.
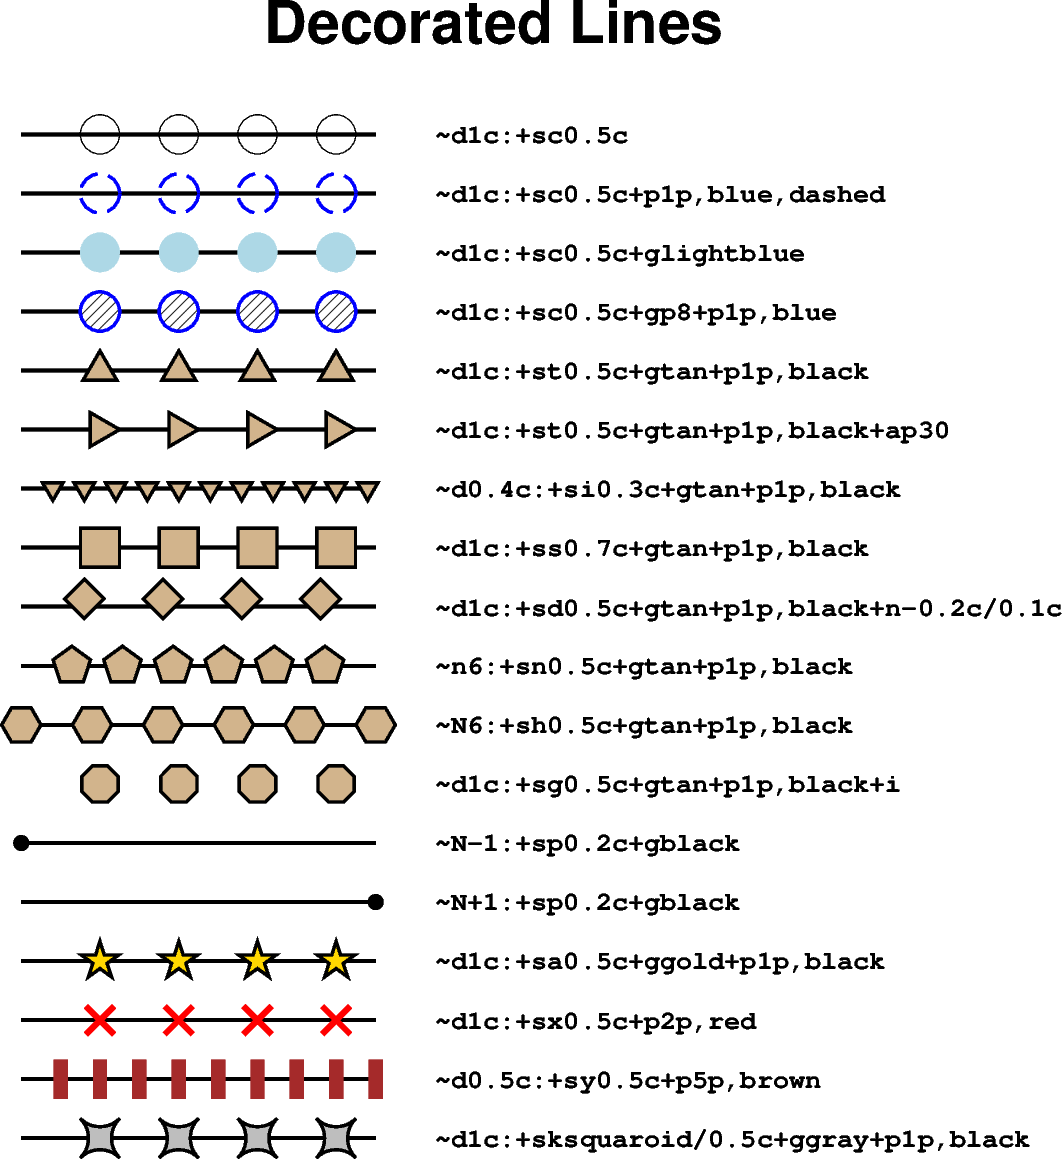
Decorated lines
To draw a so-called decorated line, i.e., symbols along a line or curve, use the
style parameter of the pygmt.Figure.plot method with the argument "~"
and the desired modifiers. A colon (":") is used to separate the algorithm
settings from the symbol information. This example shows how to adjust the symbols.
Beside the built-in symbols also custom symbols can be used. For modifying the main
decorated line via the pen parameter, see the
Line styles example. For details on the input data
see the upstream GMT documentation at https://docs.generic-mapping-tools.org/6.6/plot.html#s. Furthermore, there are
so-called line fronts, which are often used to plot fault lines, subduction zones,
or weather fronts; for details see the
Line fronts example.
import numpy as np
import pygmt
from pygmt.params import Frame

# Generate a two-point line for plotting
x = np.array([1, 4])
y = np.array([24, 24])

fig = pygmt.Figure()
fig.basemap(
    region=[0, 10, 0, 24], projection="X15c", frame=Frame(title="Decorated Lines")
)

# Plot different decorated lines
for decoline in [
    # Line with circles ("c") of 0.5 centimeters radius in distance of 1 centimeter
    "~d1c:+sc0.5c",
    # Adjust thickness, color, and style of the outline via "+p"
    # Here, we plot a 1-point thick, blue, dashed outline
    "~d1c:+sc0.5c+p1p,blue,dashed",
    # Add a fill color using "+g" with the desired color
    "~d1c:+sc0.5c+glightblue",
    # To use a pattern as fill append "p" and give the pattern number
    "~d1c:+sc0.5c+gp8+p1p,blue",
    # Line with triangles ("t")
    "~d1c:+st0.5c+gtan+p1p,black",
    # Rotate counter-clockwise from line-parallel ("+ap") by 30 degrees
    "~d1c:+st0.5c+gtan+p1p,black+ap30",
    # Line with inverse triangles with a size of 0.3 centimeters in a
    # distance of 0.4 centimeters
    "~d0.4c:+si0.3c+gtan+p1p,black",
    # Line with squares ("s") with a size of 0.7 centimeters in a distance of
    # 1 centimeter
    "~d1c:+ss0.7c+gtan+p1p,black",
    # Shift symbols using "+n" in x- and y-directions relative to the main decorated
    # line
    "~d1c:+sd0.5c+gtan+p1p,black+n-0.2c/0.1c",
    # Give the number of equally spaced symbols by using "n" instead of "d"
    "~n6:+sn0.5c+gtan+p1p,black",
    # Use uppercase "N" to have symbols at the start and end of the line
    "~N6:+sh0.5c+gtan+p1p,black",
    # Suppress the main decorated line by appending "+i"
    "~d1c:+sg0.5c+gtan+p1p,black+i",
    # To only plot a symbol at the start of the line use "N-1"
    "~N-1:+sp0.2c+gblack",
    # To only plot a symbol at the end of the line use "N+1"
    "~N+1:+sp0.2c+gblack",
    # Line with stars ("a")
    "~d1c:+sa0.5c+ggold+p1p,black",
    # Line with crosses ("x")
    "~d1c:+sx0.5c+p2p,red",
    # Line with (vertical) lines or bars ("y")
    "~d0.5c:+sy0.5c+p5p,brown",
    # Use custom symbol ("k") "squaroid" with a size of 0.5 centimeters
    "~d1c:+sksquaroid/0.5c+ggray+p1p,black",
]:
    y = y - 1.2  # Move current line down
    fig.plot(x=x, y=y, style=decoline, pen="1.25p,black")
    fig.text(
        x=x[-1],
        y=y[-1],
        text=decoline,
        font="Courier-Bold",
        justify="ML",
        offset=(0.75, 0),
    )

fig.show()
Total running time of the script: (0 minutes 0.322 seconds)