Note
Go to the end to download the full example code.
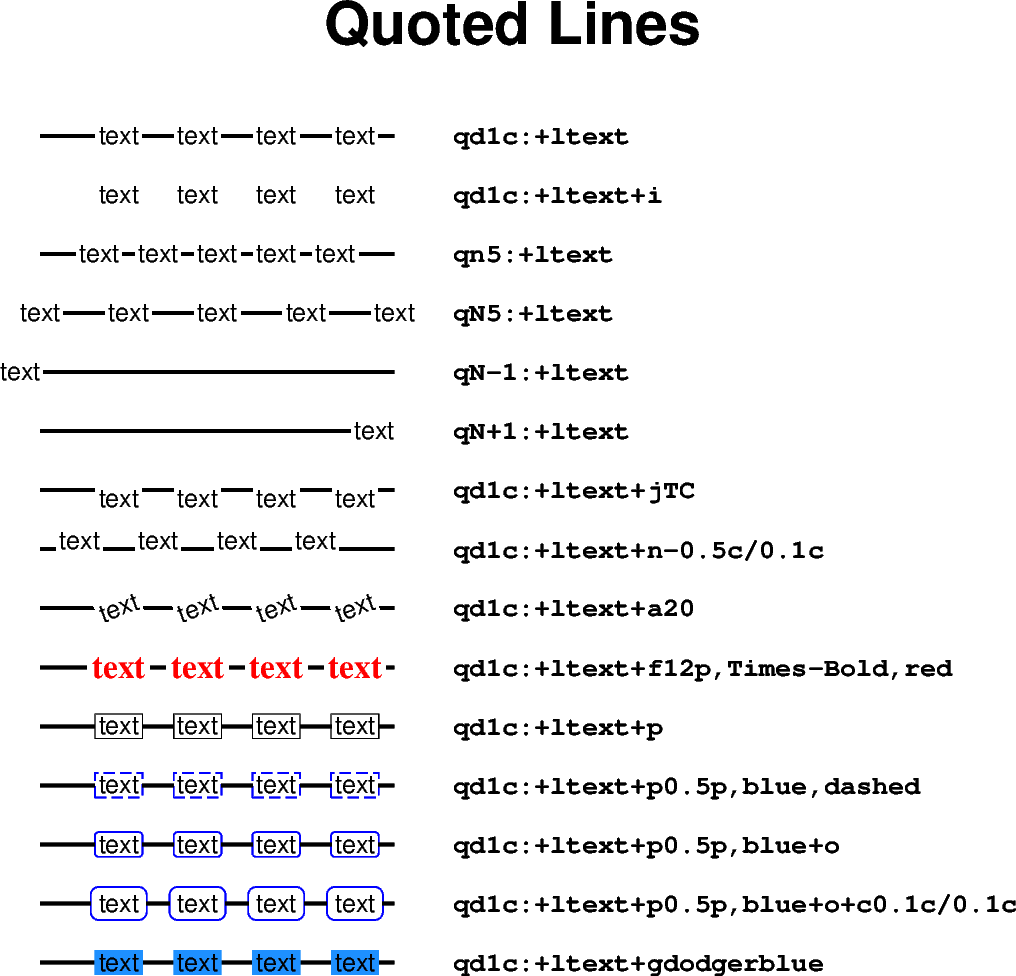
Quoted lines
To plot a so-called quoted line, i.e., labels along a line
or curve, use the style parameter of the
pygmt.Figure.plot method with the argument "q" and the
desired modifiers. A colon (":") is used to separate the
algorithm settings from the label information.
This example shows how to adjust the labels.
For modifying the main quoted line via the pen parameter,
see the Line styles example.
For details on the input data see the upstream GMT documentation
at https://docs.generic-mapping-tools.org/6.6/plot.html#s.
import numpy as np
import pygmt
from pygmt.params import Frame

# Generate a two-point line for plotting
x = np.array([1, 4])
y = np.array([20, 20])

fig = pygmt.Figure()
fig.basemap(
    region=[0, 10, 0, 20], projection="X15c/15c", frame=Frame(title="Quoted Lines")
)

# Plot different quoted lines
for quotedline in [
    # Line with labels ("+l") "text" in distance ("d") of 1 centimeter
    "qd1c:+ltext",
    # Suppress the main quoted line by appending "+i"
    "qd1c:+ltext+i",
    # Give the number of equally spaced labels by using "n" instead of "d"
    "qn5:+ltext",
    # Use uppercase "N" to have labels at the start and end of the line
    "qN5:+ltext",
    # To only plot a label at the start of the line use "N-1"
    "qN-1:+ltext",
    # To only plot a label at the end of the line use "N+1"
    "qN+1:+ltext",
    # Adjust the justification of the labels via "+j", here Top Center
    "qd1c:+ltext+jTC",
    # Shift labels using "+n" in x- and y-directions relative to the main
    # quoted line
    "qd1c:+ltext+n-0.5c/0.1c",
    # Rotate labels via "+a" (counter-clockwise from horizontal)
    "qd1c:+ltext+a20",
    # Adjust size, type, and color of the font via "+f"
    "qd1c:+ltext+f12p,Times-Bold,red",
    # Add a box around the label via "+p"
    "qd1c:+ltext+p",
    # Adjust thickness, color, and style of the outline
    "qd1c:+ltext+p0.5p,blue,dashed",
    # Append "+o" to get a box with rounded edges
    "qd1c:+ltext+p0.5p,blue+o",
    # Adjust the space between label and box in x- and y-directions via "+c"
    "qd1c:+ltext+p0.5p,blue+o+c0.1c/0.1c",
    # Give a fill of the box via "+g" together with the desired color
    "qd1c:+ltext+gdodgerblue",
]:
    y -= 1  # Move current line down
    fig.plot(x=x, y=y, pen="1.25p", style=quotedline)
    fig.text(
        x=x[-1],
        y=y[-1],
        text=quotedline,
        font="Courier-Bold",
        justify="ML",
        offset=(0.75, 0),
    )

fig.show()
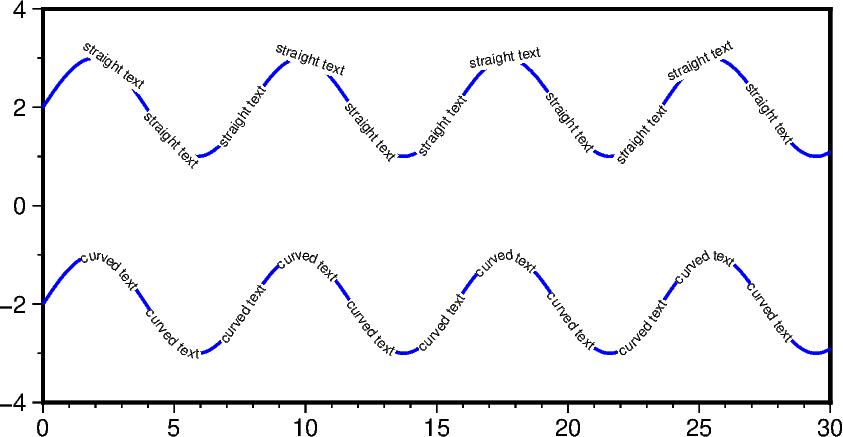
For curved labels following the line, append "+v" to the argument passed
to the style parameter.
# Generate sine curve
x = np.arange(0, 10 * np.pi, 0.1)
y = np.sin(0.8 * x)

fig = pygmt.Figure()

fig.basemap(region=[0, 30, -4, 4], projection="X10c/5c", frame=True)

fig.plot(x=x, y=y + 2, style="qd1.2c:+lstraight text+f5p", pen="1p,blue")

fig.plot(
    x=x,
    y=y - 2,
    # Append "+v" to force curved labels
    style="qd1.2c:+lcurved text+f5p+v",
    pen="1p,blue",
)

fig.show()
Total running time of the script: (0 minutes 1.162 seconds)