Note
Go to the end to download the full example code.
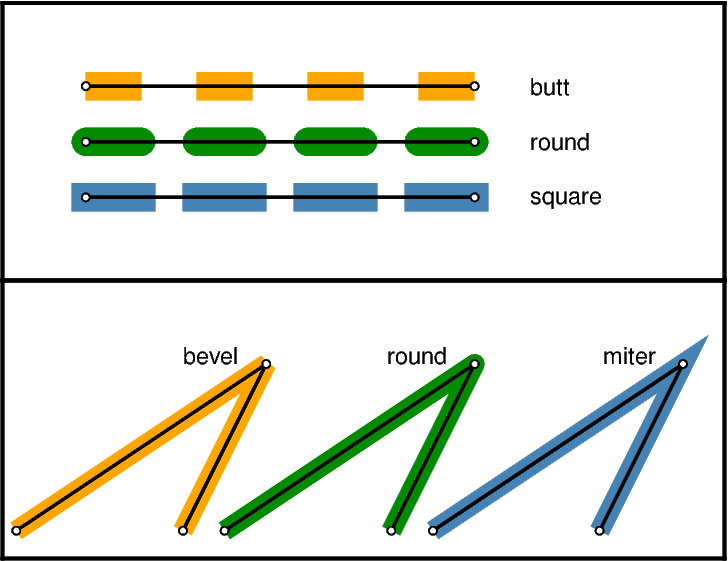
Line segment caps and joints
PyGMT offers different appearances of line segment caps and joints. The desired
appearance can be set via the GMT default parameters PS_LINE_CAP
("butt", "round", or "square" [Default]) as well as PS_LINE_JOIN
("bevel", "round", and "miter" [Default]) and PS_MITER_LIMIT
(limit on the angle at the mitered joint below which a bevel is applied).
import numpy as np
import pygmt
from pygmt.params import Frame

# Set up dictionary for colors
dict_col = {
    "round": "green4",
    "square": "steelblue",
    "butt": "orange",
    "miter": "steelblue",
    "bevel": "orange",
}

# Create new Figure instance
fig = pygmt.Figure()

# -----------------------------------------------------------------------------
# Top: PS_LINE_CAP

# Create sample data
x = np.array([30, 170])
y = np.array([70, 70])

fig.basemap(region=[0, 260, 0, 100], projection="x1p", frame=Frame(axes="rltb"))

for line_cap in ["butt", "round", "square"]:
    # Change GMT default locally
    with pygmt.config(PS_LINE_CAP=line_cap):
        color = dict_col[line_cap]
        # Draw a 10-point thick line with 20-point long segments and gaps
        # Use the local PS_LINE_CAP setting
        fig.plot(x=x, y=y, pen=f"10p,{color},20_20")

    # Draw a 1-point thick black solid line to highlight segment cap appearance
    fig.plot(x=x, y=y, pen="1p,black,solid")
    # Plot data points as circles
    fig.plot(x=x, y=y, style="c0.1c", fill="white", pen="0.5p,")
    # Add label for PS_LINE_CAP setting
    fig.text(text=line_cap, x=x[-1] + 20, y=y[-1], justify="LM")

    y = y - 20

fig.shift_origin(yshift="-h")

# -----------------------------------------------------------------------------
# Bottom: PS_LINE_JOIN and PS_MITER_LIMIT

x = np.array([5, 95, 65])
y = np.array([10, 70, 10])

fig.basemap(region=[0, 260, 0, 100], projection="x1p", frame=Frame(axes="rltb"))

for line_join in ["bevel", "round", "miter"]:
    with pygmt.config(PS_LINE_JOIN=line_join, PS_MITER_LIMIT=1):
        color = dict_col[line_join]
        # Draw a 7-point thick solid line
        # Use the local PS_LINE_JOIN and PS_MITER_LIMIT settings
        fig.plot(x=x, y=y, pen=f"7p,{color},solid")

    fig.plot(x=x, y=y, pen="1p,black,solid")
    fig.plot(x=x, y=y, style="c0.1c", fill="white", pen="0.5p")
    fig.text(text=line_join, x=x[1] - 10, y=y[1], justify="RB")

    x = x + 75

fig.show()
Total running time of the script: (0 minutes 0.218 seconds)