Note
Go to the end to download the full example code.
Vector heads and tails
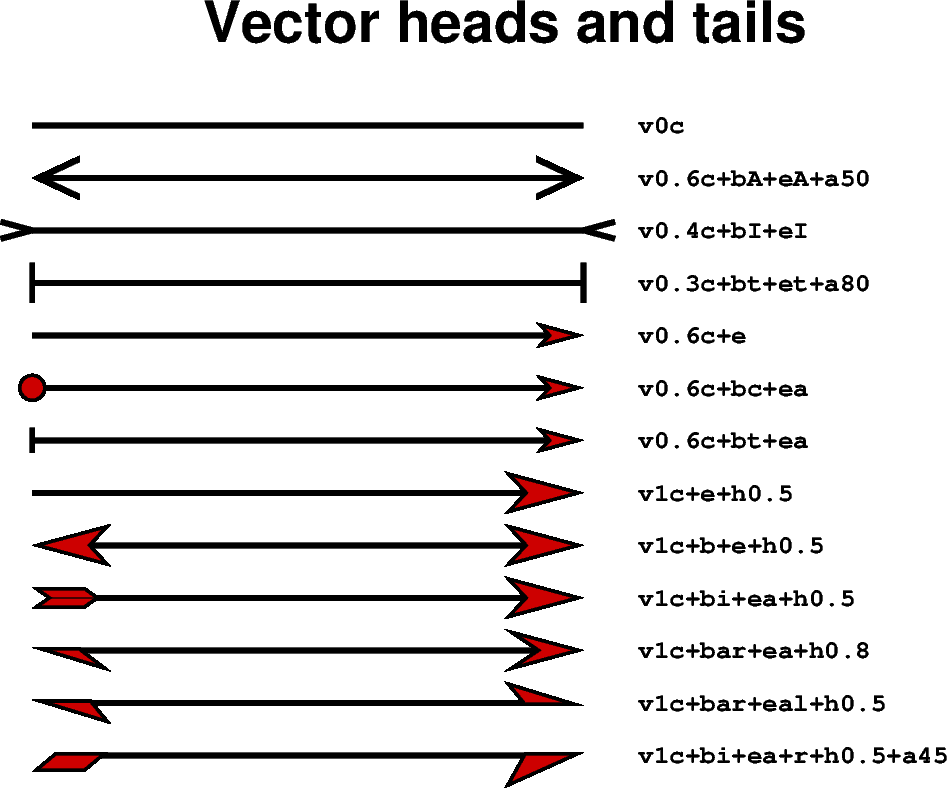
Many methods in PyGMT allow plotting vectors with individual heads and tails. For this purpose, several modifiers may be appended to the corresponding vector-producing parameters for specifying the placement of vector heads and tails, their shapes, and the justification of the vector.
To place a vector head at the beginning of the vector path
simply append +b to the vector-producing option (use +e to place
one at the end). Optionally, append t for a terminal line, c for a
circle, a for arrow (default), i for tail, A for plain open
arrow, and I for plain open tail. Further append l or r (e.g.
"+bar") to only draw the left or right half-sides of the selected head/tail
(default is both sides) or use +l or +r to apply simultaneously to both
beginning and end. In this context, left and right refer to the side of the
vector line when viewed from the beginning point to the end point of a line
segment. The angle of the vector head apex can be set using +aangle
(default is 30). The shape of the vector head can be adjusted using
+hshape (e.g. "+h0.5").
For further modifiers see https://docs.generic-mapping-tools.org/6.6/plot.html#vector-attributes.
In the following, we use the pygmt.Figure.plot method to plot vectors
with individual heads and tails. We must specify the modifiers (together with
the vector type, here "v" for Cartesian vector, see also the
Vector types example)
by passing the corresponding shortcuts to the style parameter.

import pygmt

fig = pygmt.Figure()
fig.basemap(
    region=[0, 10, 0, 15], projection="X15c/10c", frame="+tVector heads and tails"
)

x = 1
y = 14
angle = 0  # in degrees, measured counter-clockwise from horizontal
length = 7

for vecstyle in [
    # vector without head and tail (line)
    "v0c",
    # plain open arrow at beginning and end, angle of the vector head apex is
    # set to 50
    "v0.6c+bA+eA+a50",
    # plain open tail at beginning and end
    "v0.4c+bI+eI",
    # terminal line at beginning and end, angle of vector head apex is set
    # to 80
    "v0.3c+bt+et+a80",
    # arrow head at end
    "v0.6c+e",
    # circle at beginning and arrow head at end
    "v0.6c+bc+ea",
    # terminal line at beginning and arrow head at end
    "v0.6c+bt+ea",
    # arrow head at end, shape of vector head is set to 0.5
    "v1c+e+h0.5",
    # modified arrow heads at beginning and end
    "v1c+b+e+h0.5",
    # tail at beginning and arrow with modified vector head at end
    "v1c+bi+ea+h0.5",
    # half-sided arrow head (right side) at beginning and arrow at the end
    "v1c+bar+ea+h0.8",
    # half-sided arrow heads at beginning (right side) and end (left side)
    "v1c+bar+eal+h0.5",
    # half-sided tail at beginning and arrow at end (right side for both)
    "v1c+bi+ea+r+h0.5+a45",
]:
    fig.plot(
        x=x, y=y, style=vecstyle, direction=([angle], [length]), pen="2p", fill="red3"
    )
    fig.text(
        x=6, y=y, text=vecstyle, font="Courier-Bold", justify="ML", offset="0.2c/0c"
    )
    y -= 1  # move the next vector down

fig.show()
Total running time of the script: (0 minutes 0.250 seconds)